Graph BuilderMaking Complex Analysis Flexible and Understandable
Designed a reusable analysis workflow and worked with engineering to turn data and performance constraints into understandable interaction rules.
Users needed to compare buildings, return to analyses, share charts, and produce recurring reports. Temporary charts and fragmented data discovery made that work repetitive.
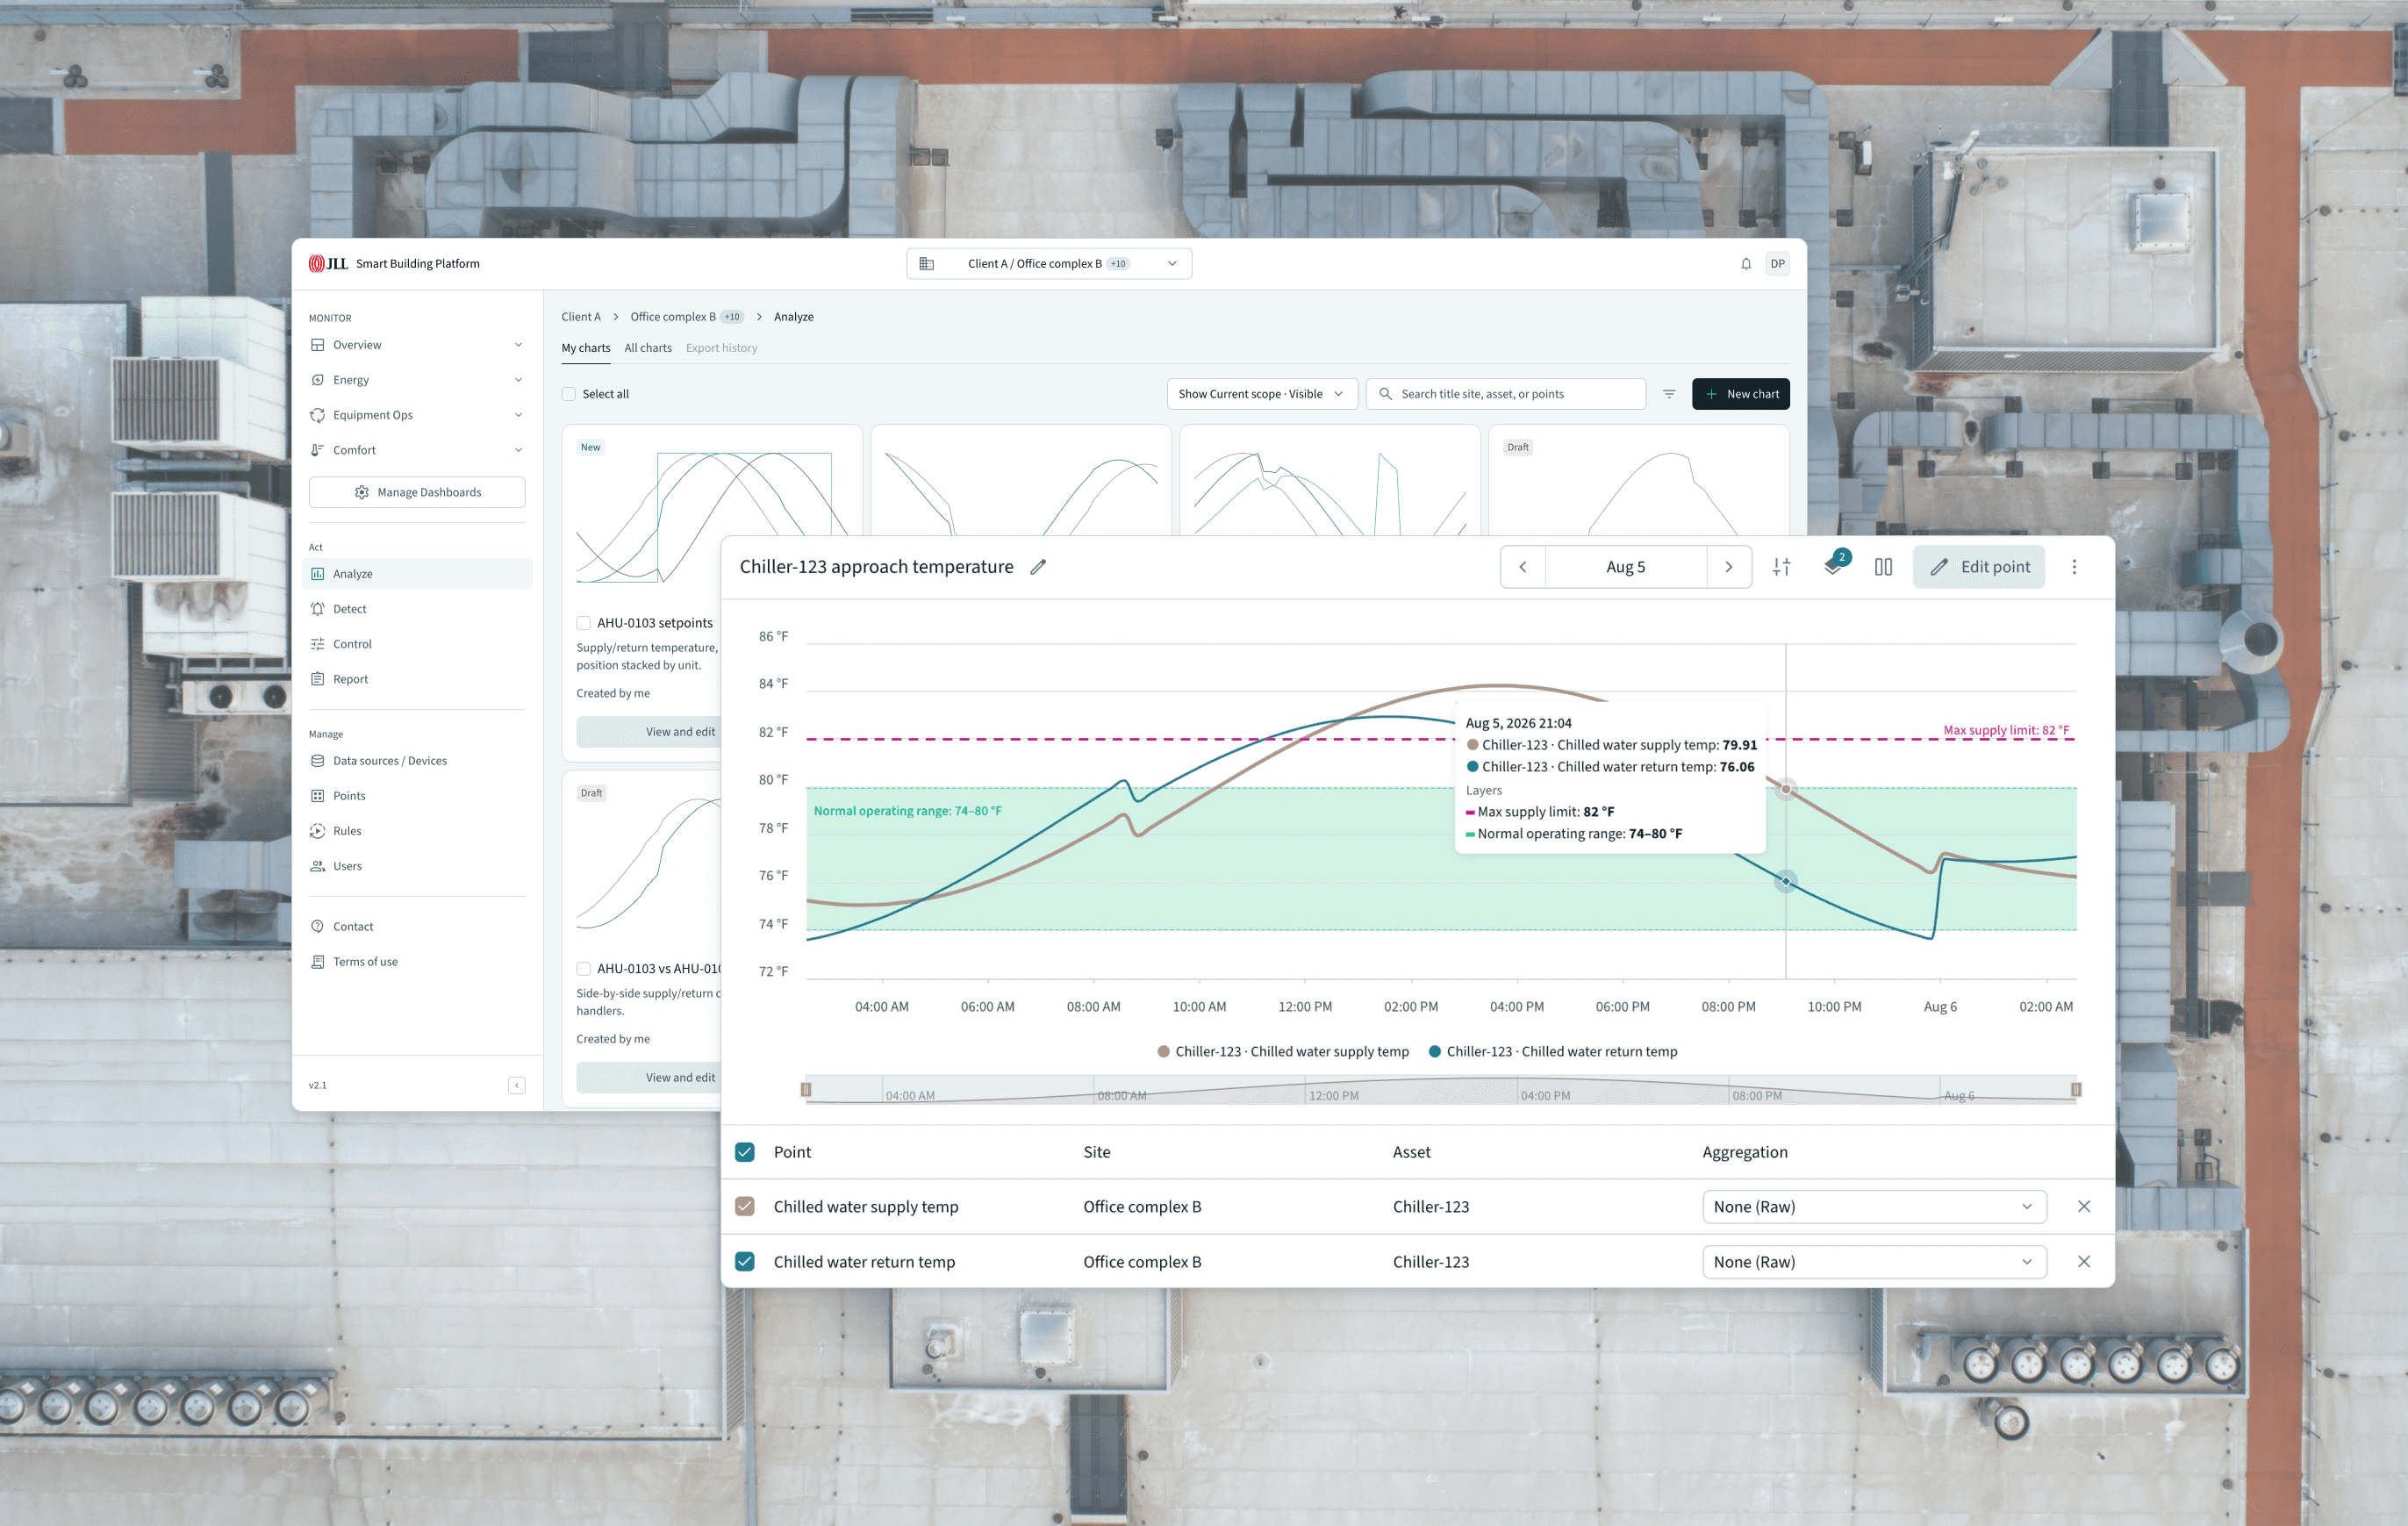
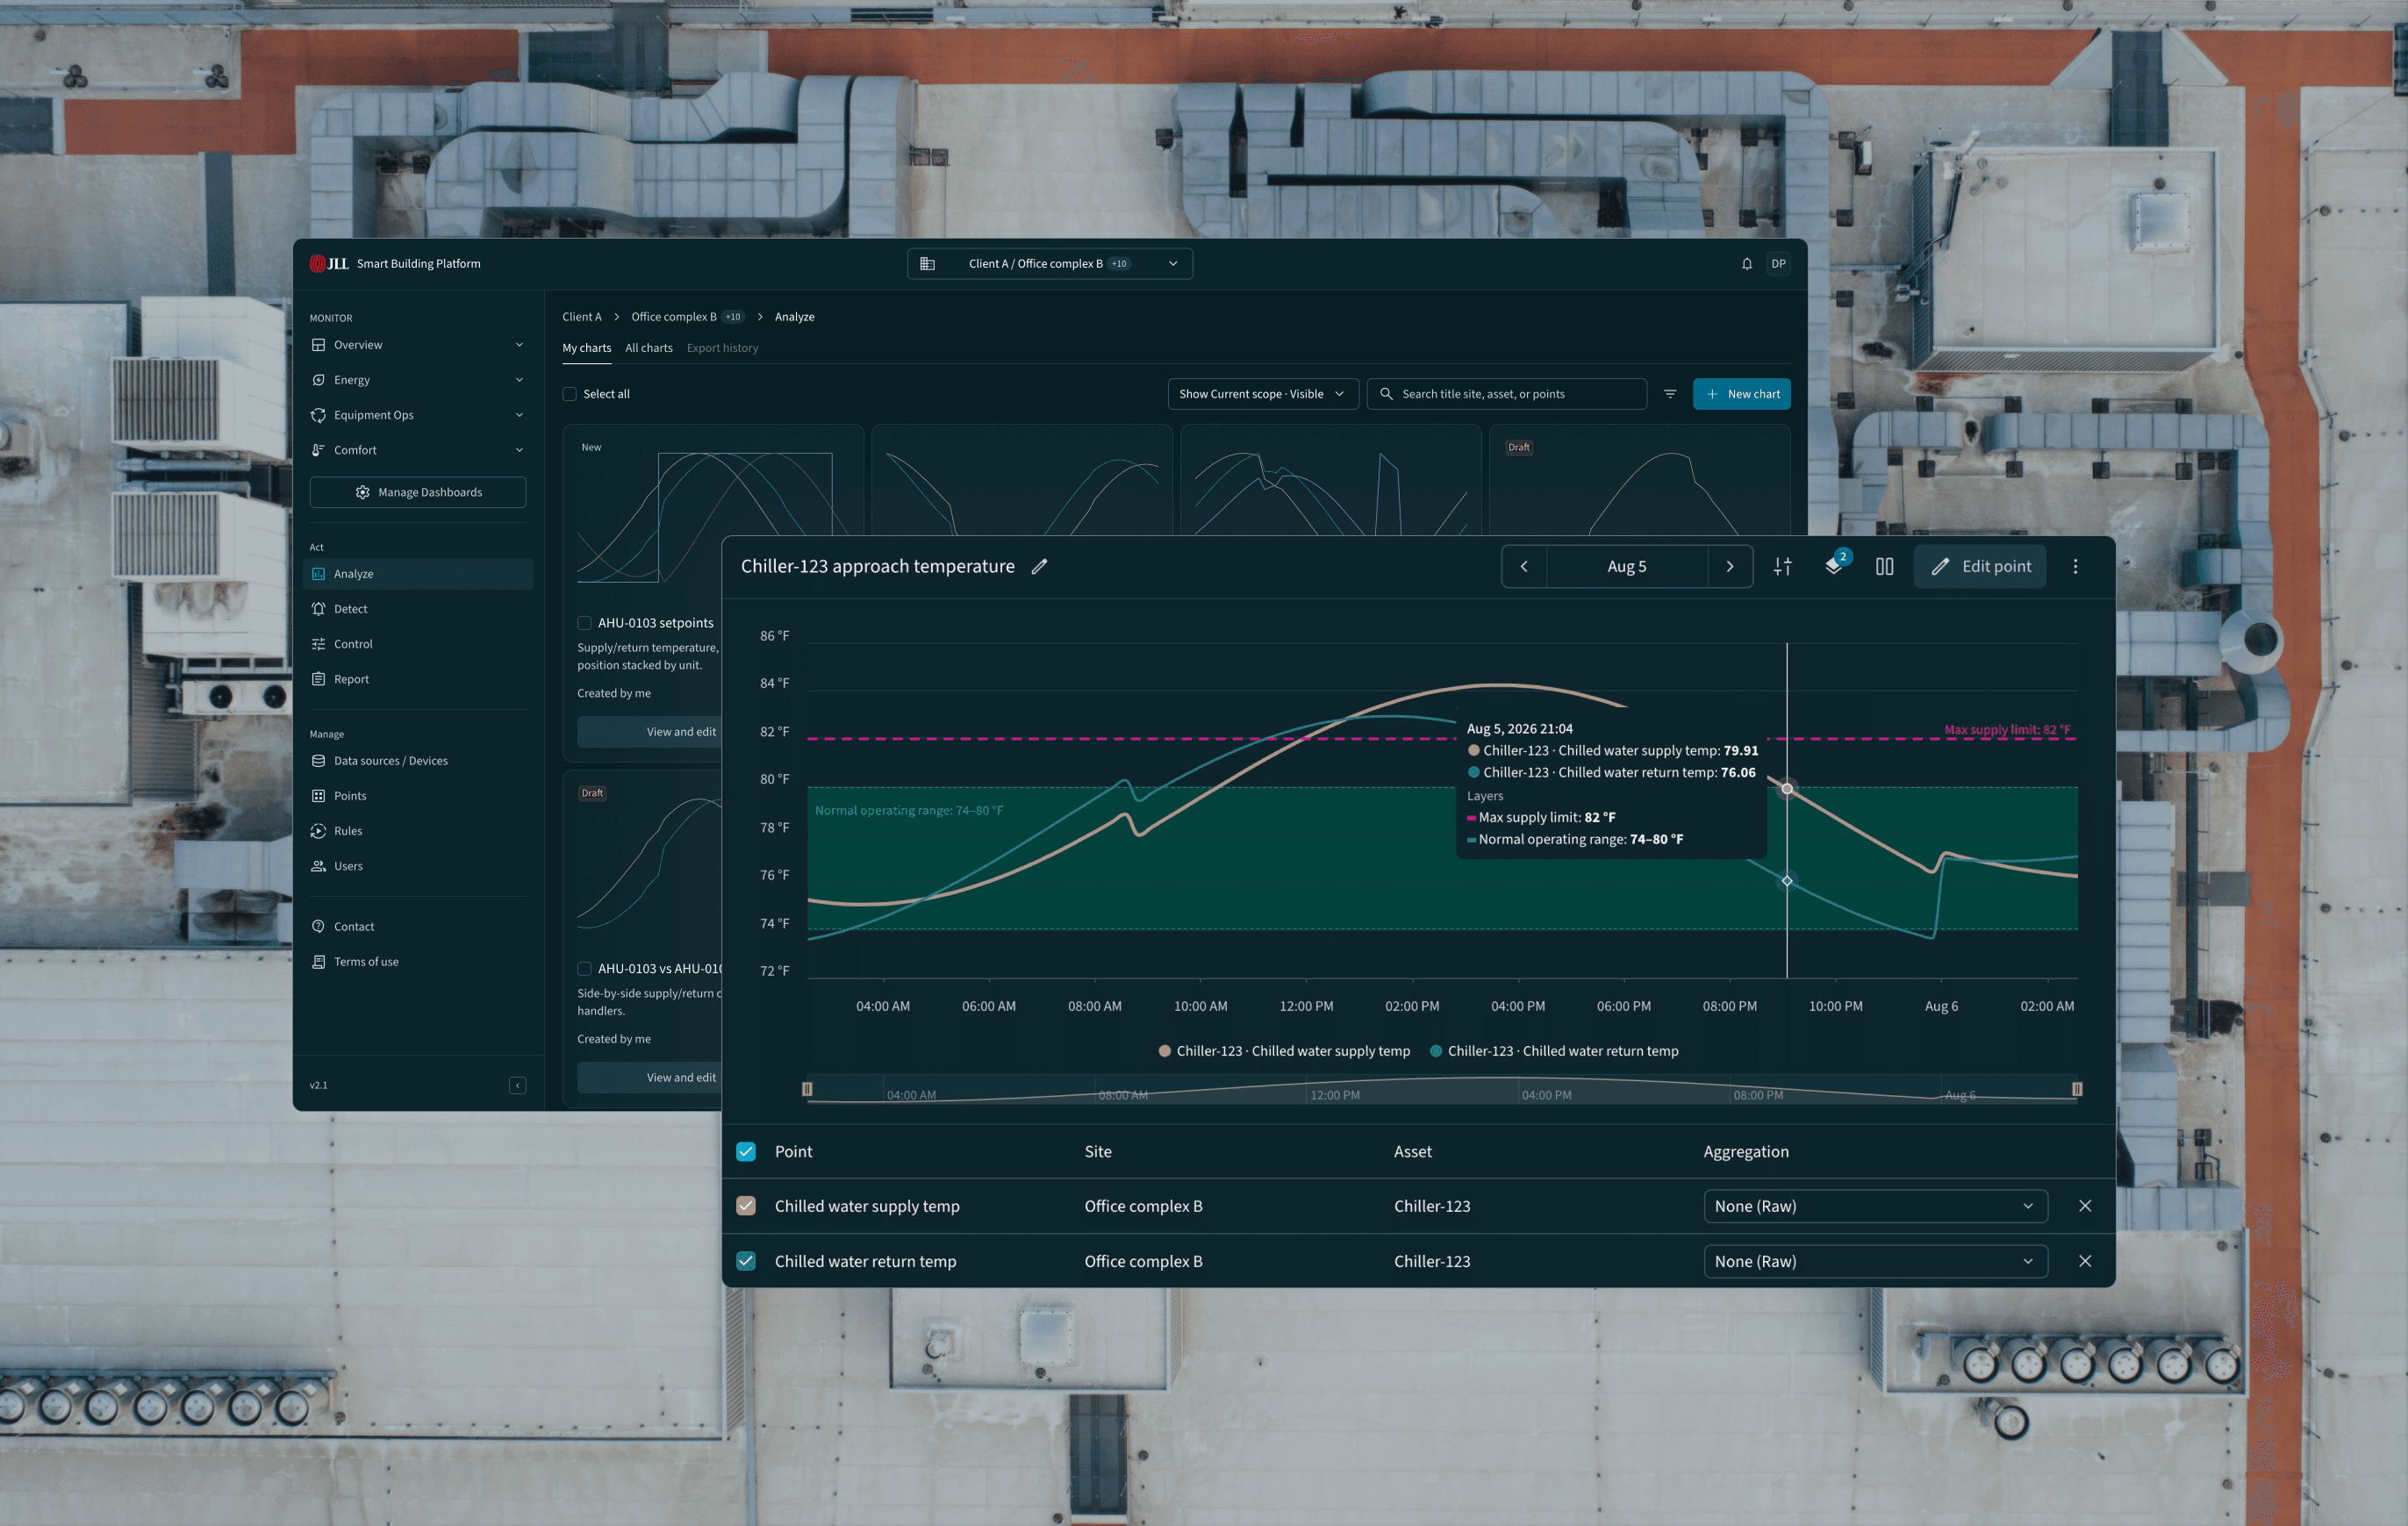
Support different starting knowledge
The design supports three starting points: find known equipment in Point Browser, use semantic tags to discover matching points, or describe an analysis to the AI Chart Assistant and review its proposed chart.
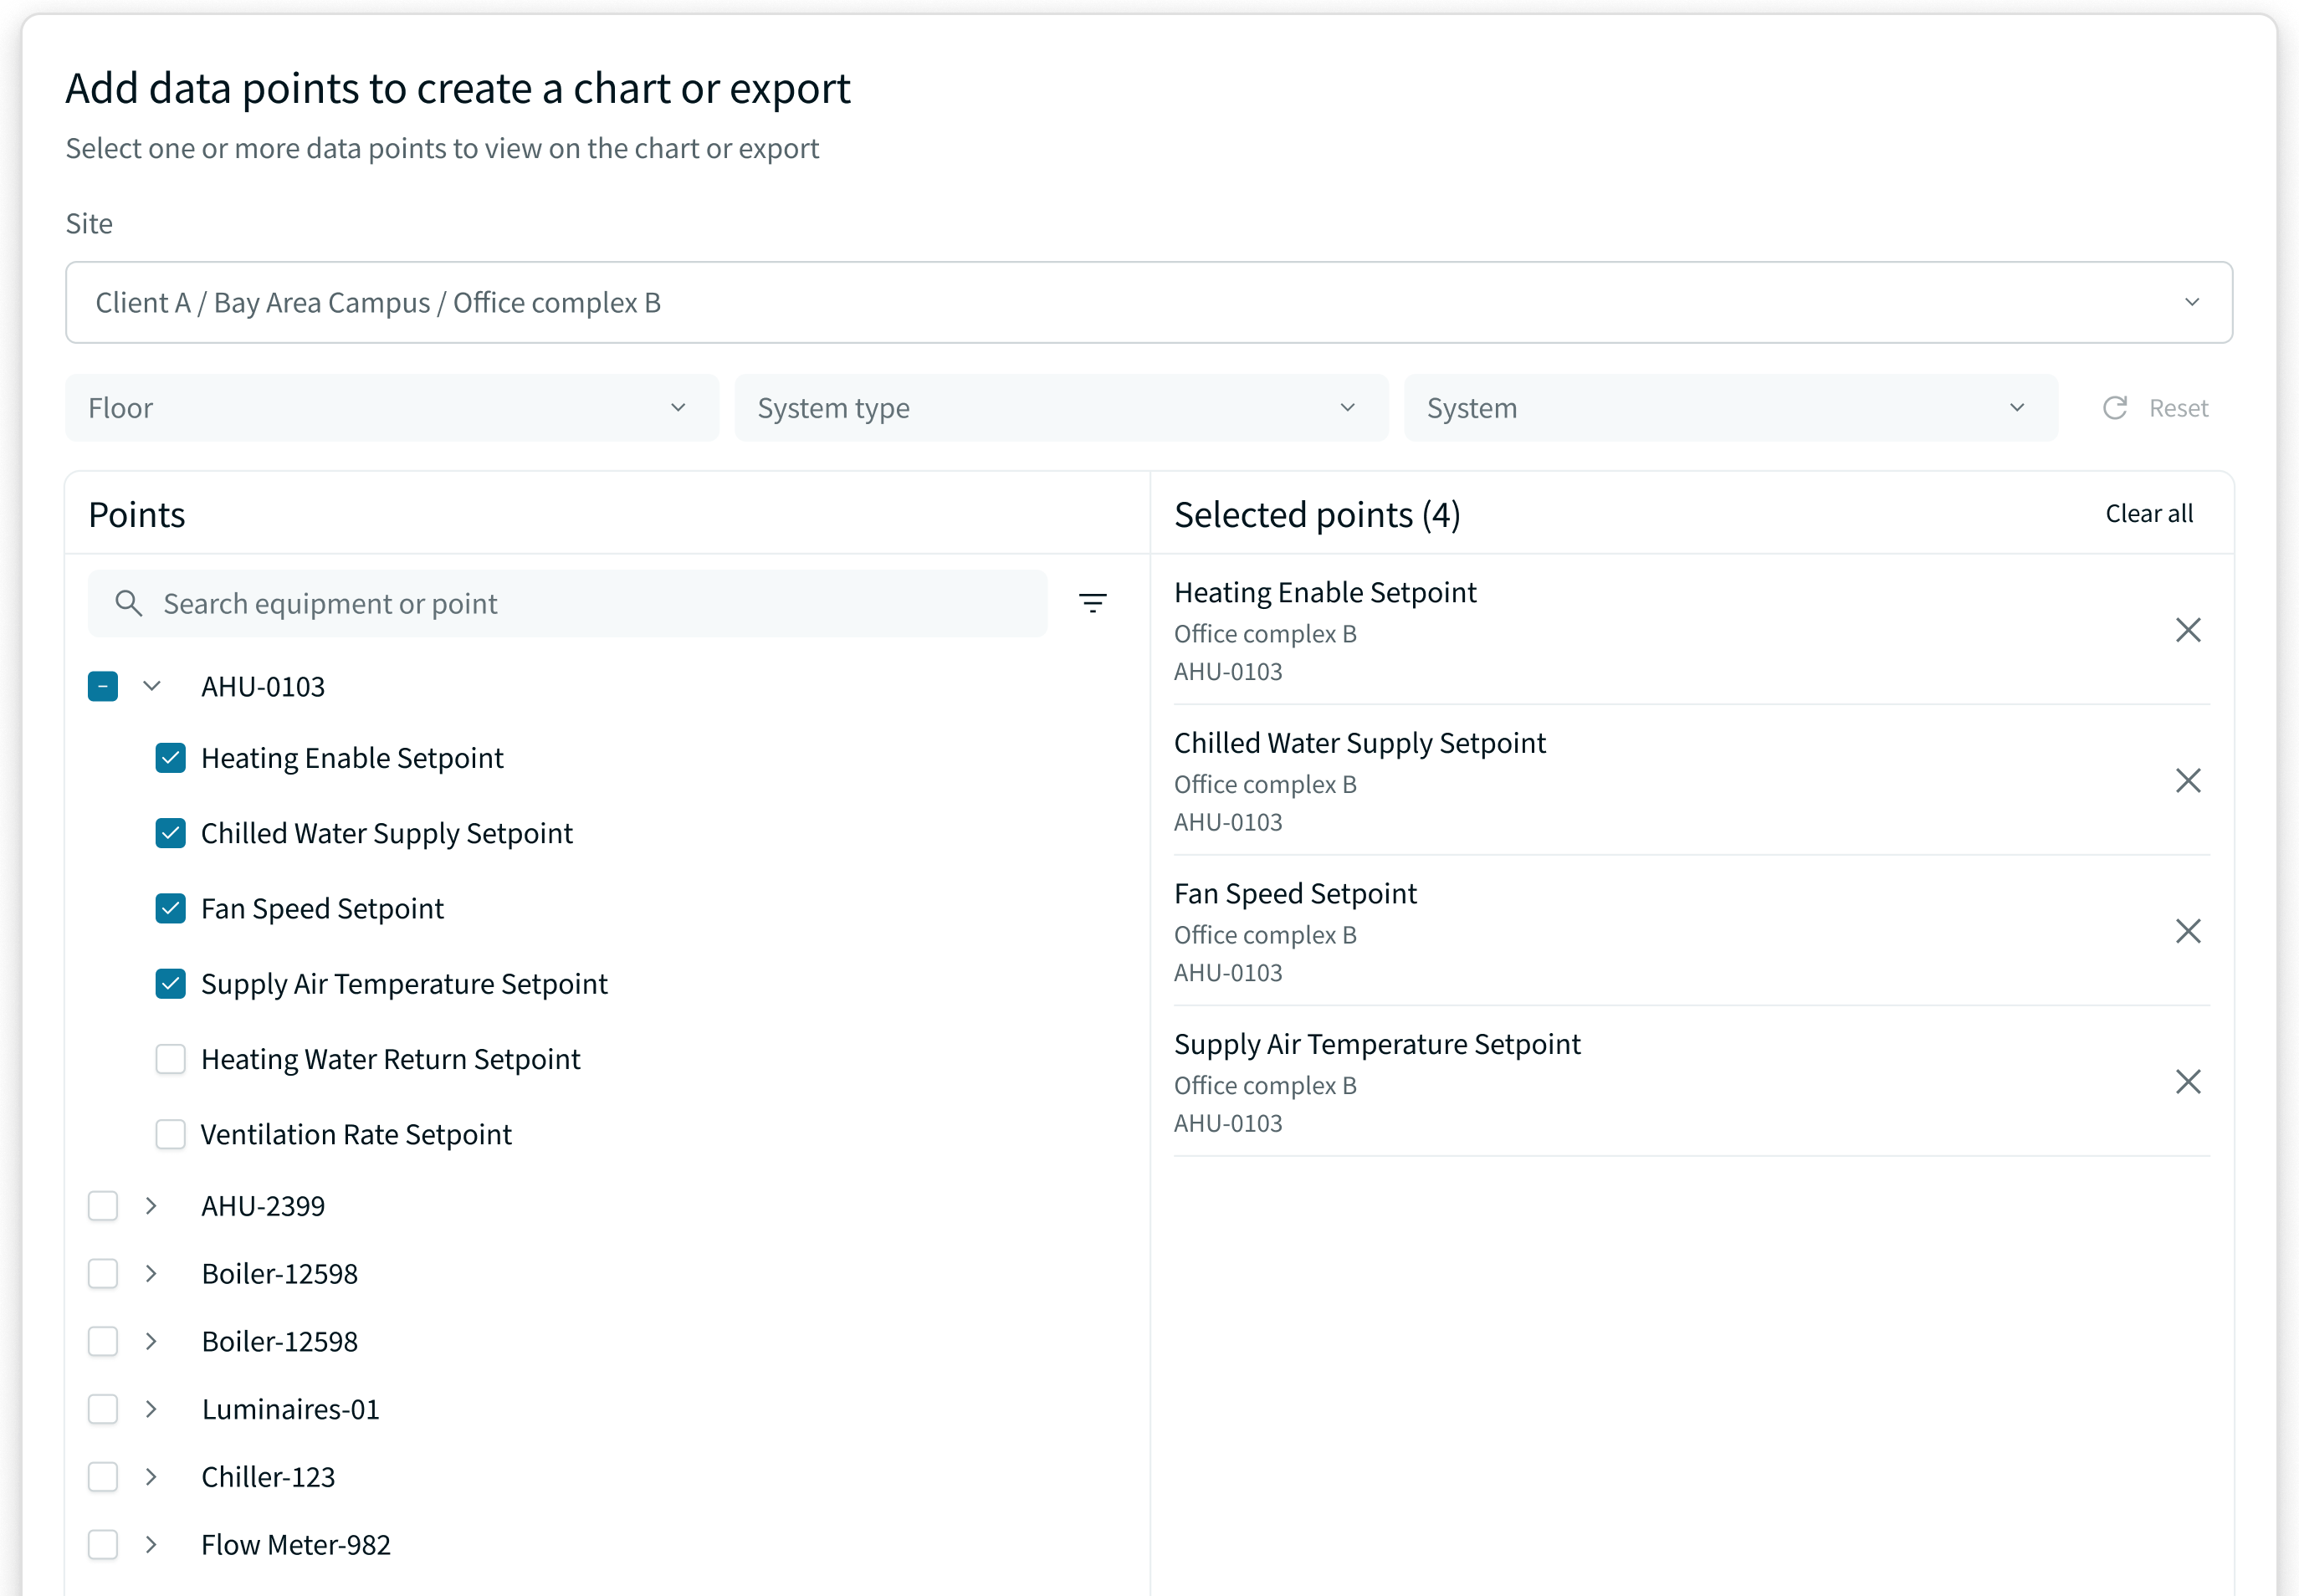
Point Browser
Search and select equipment points, then add them to a chart or export.
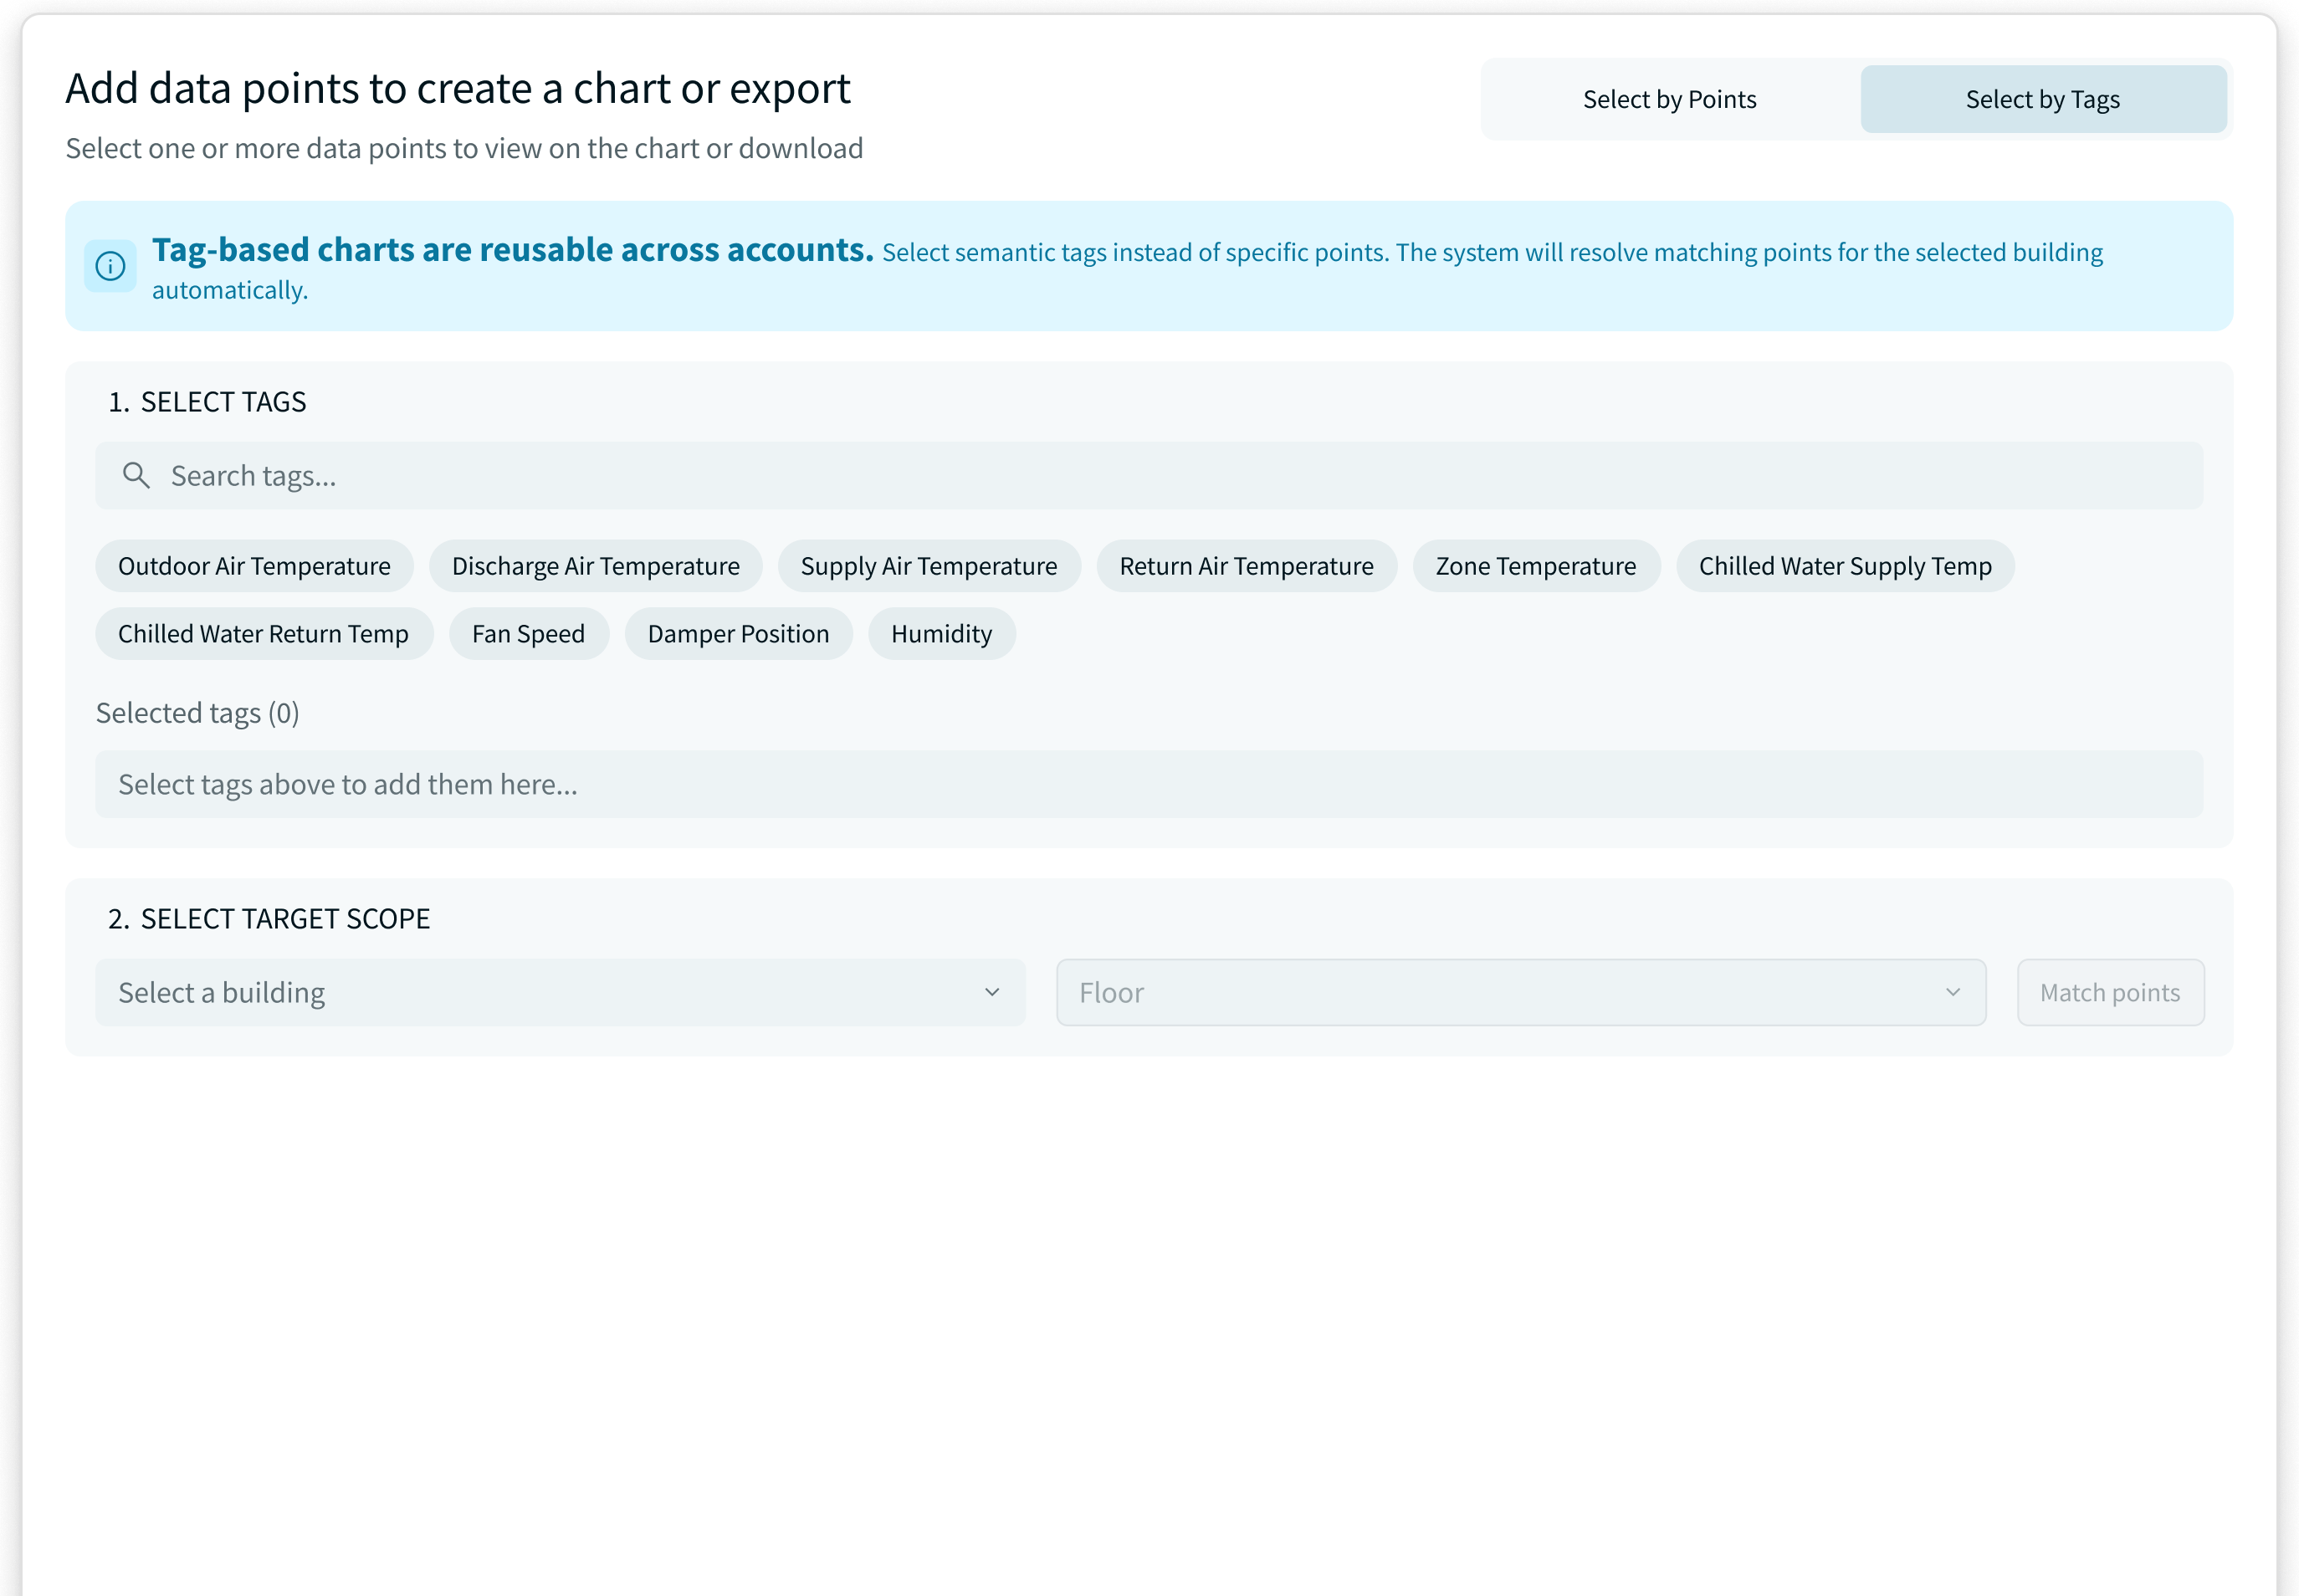
Tag-based Discovery
Select semantic tags and a target scope to find matching points.
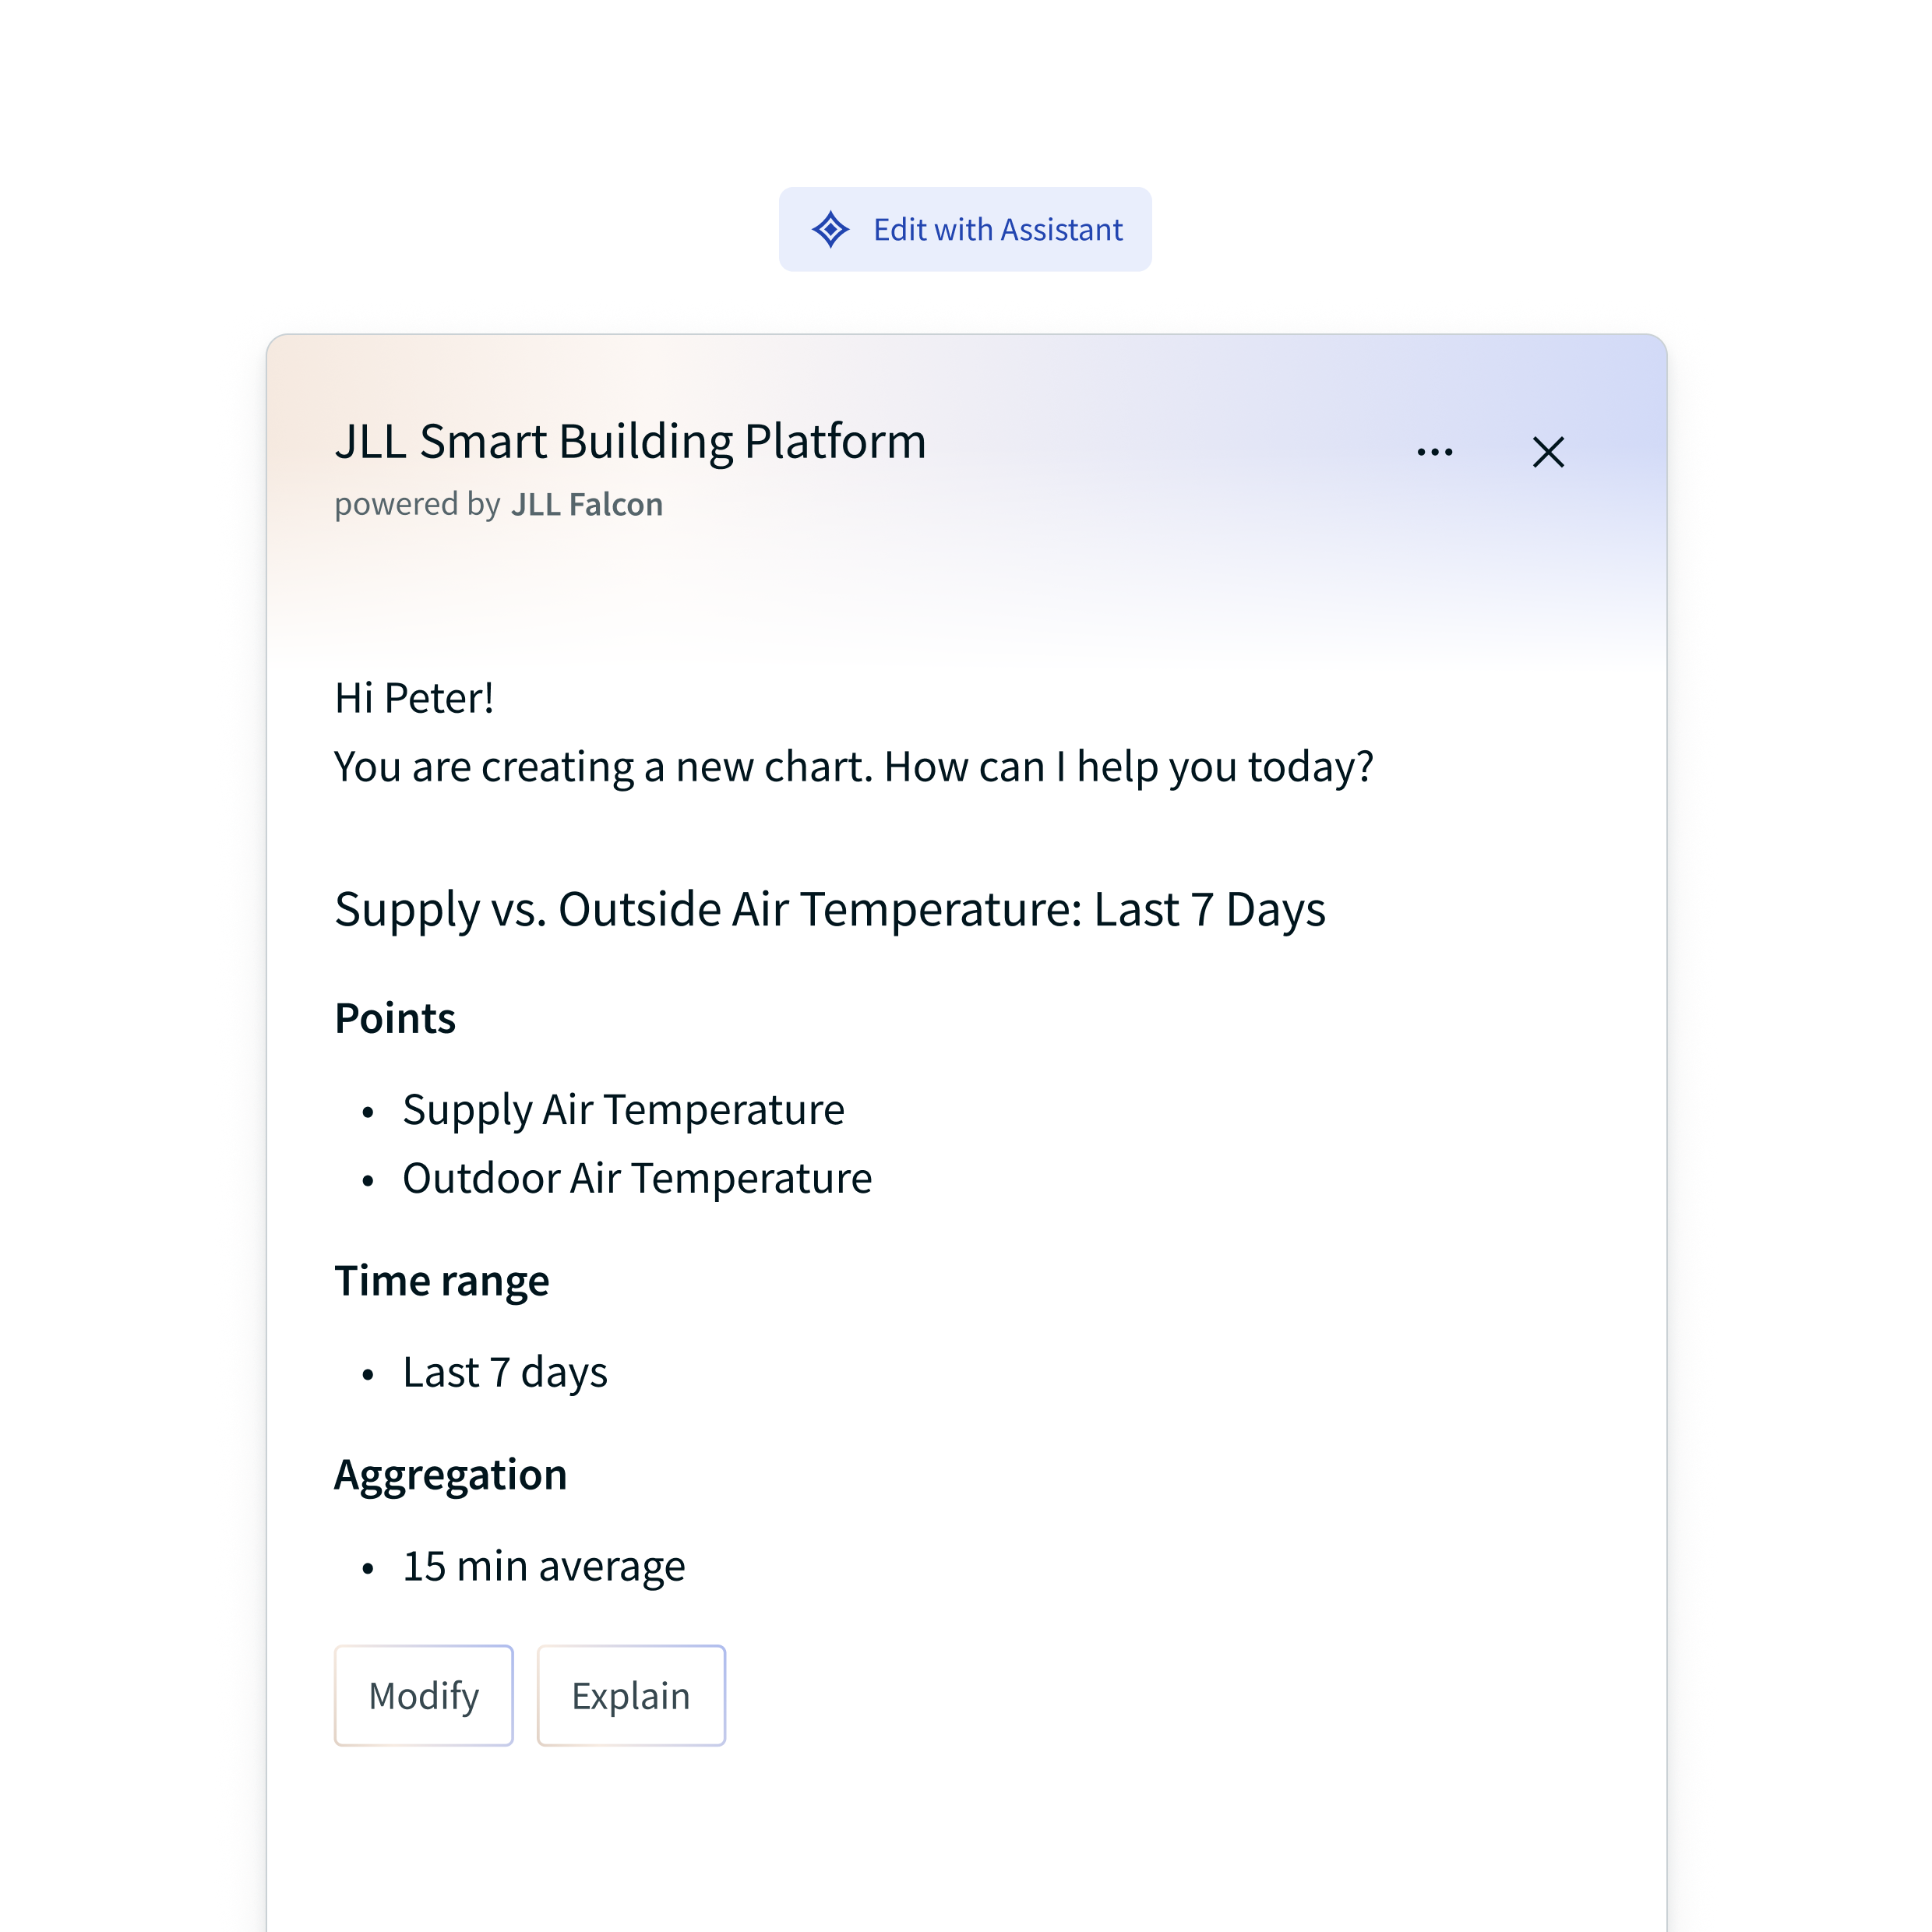
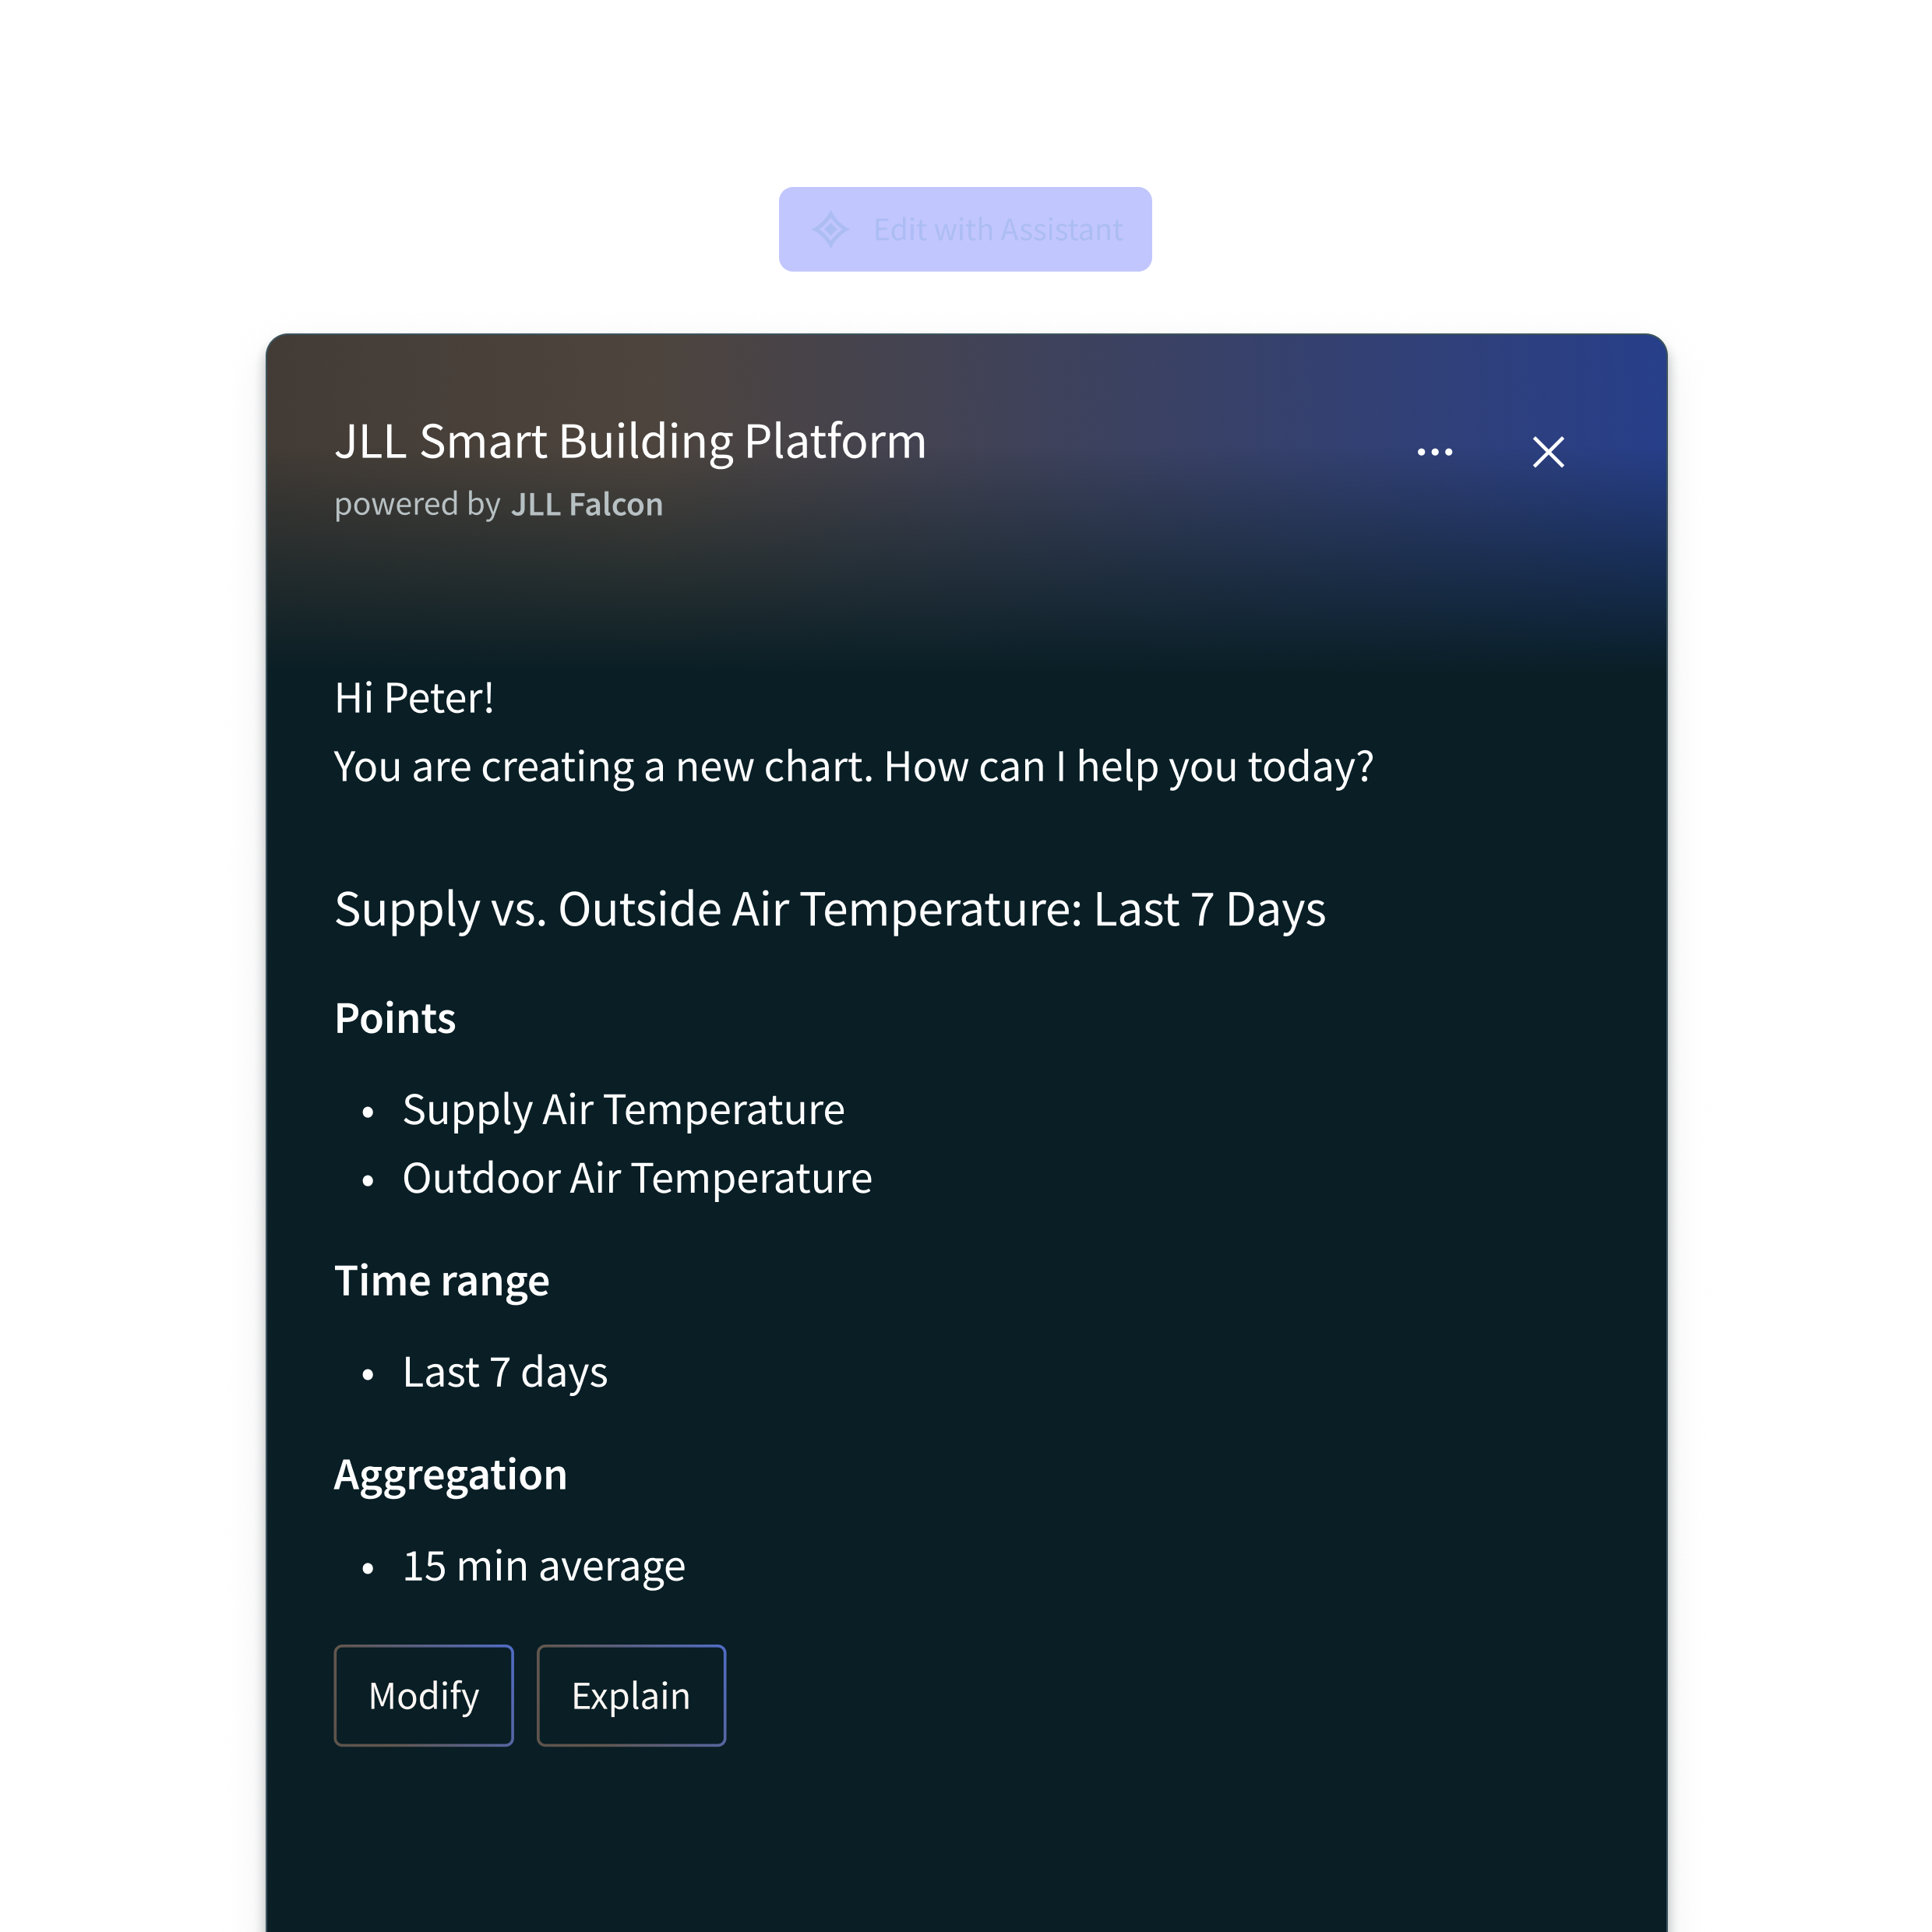
AI Chart Assistant
Describe an analysis and review the proposed chart before creating it.
Balance flexibility with clear limits
I challenged the request for unlimited chart points and worked with engineering on a warning above 10 points and a 15-point limit. Data type and retrieval frequency also shaped time-range and granularity rules.
Try the prototype
Try selecting points, configuring a chart, and comparing sample data.
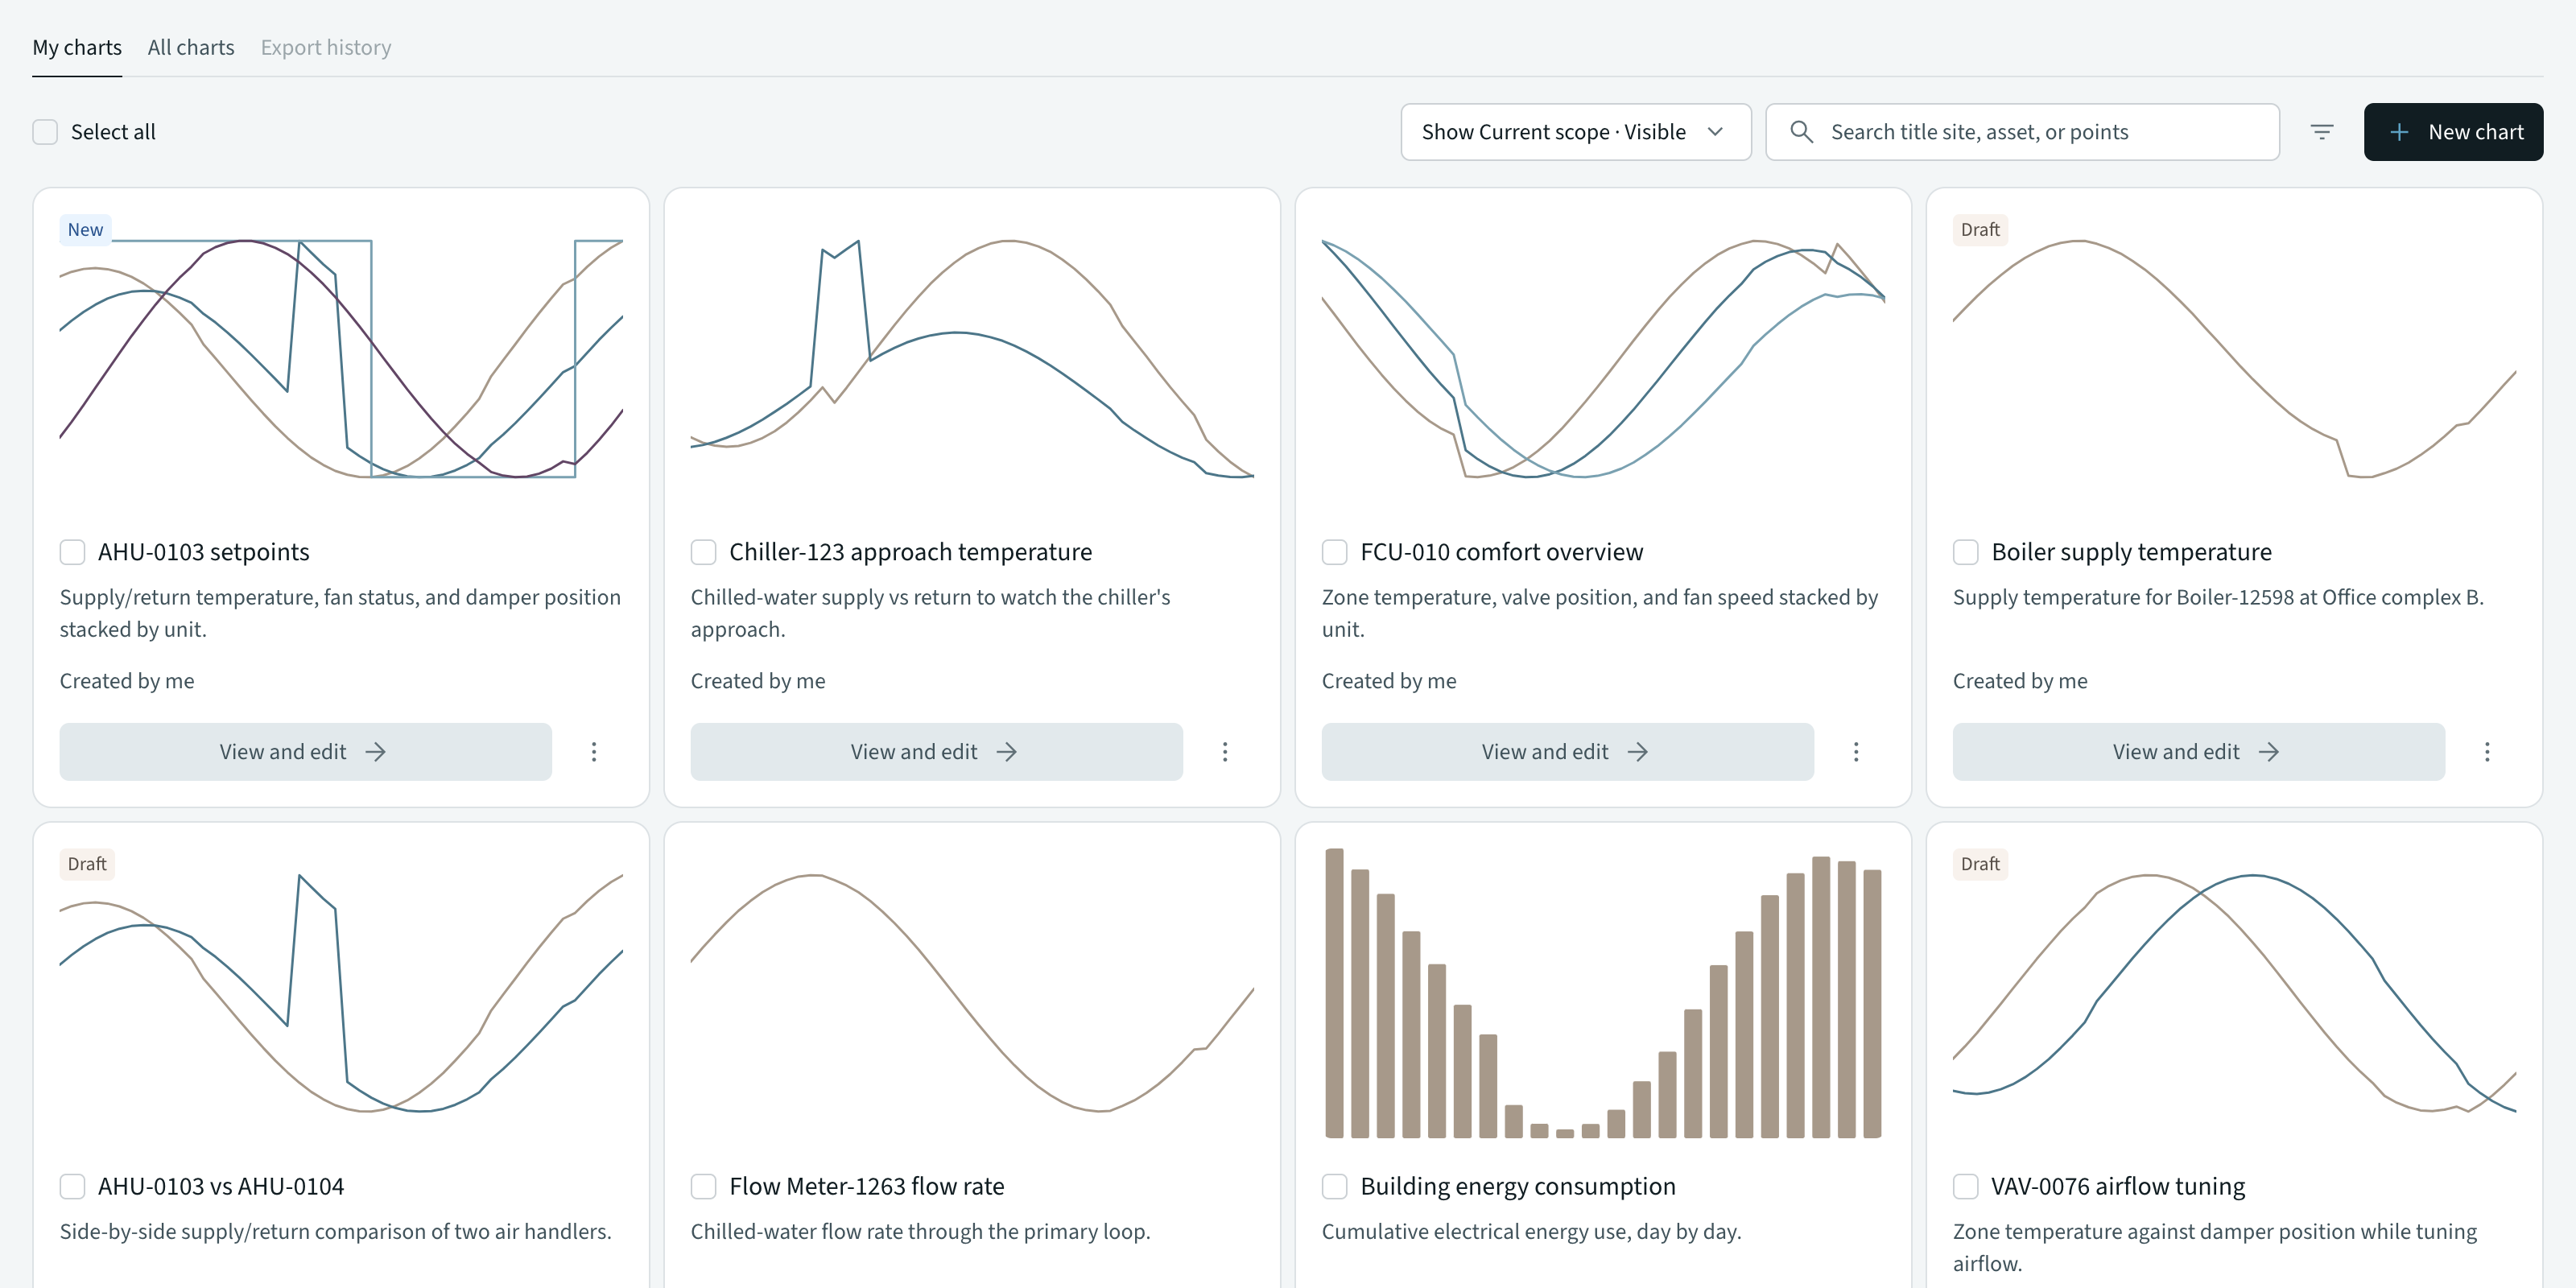
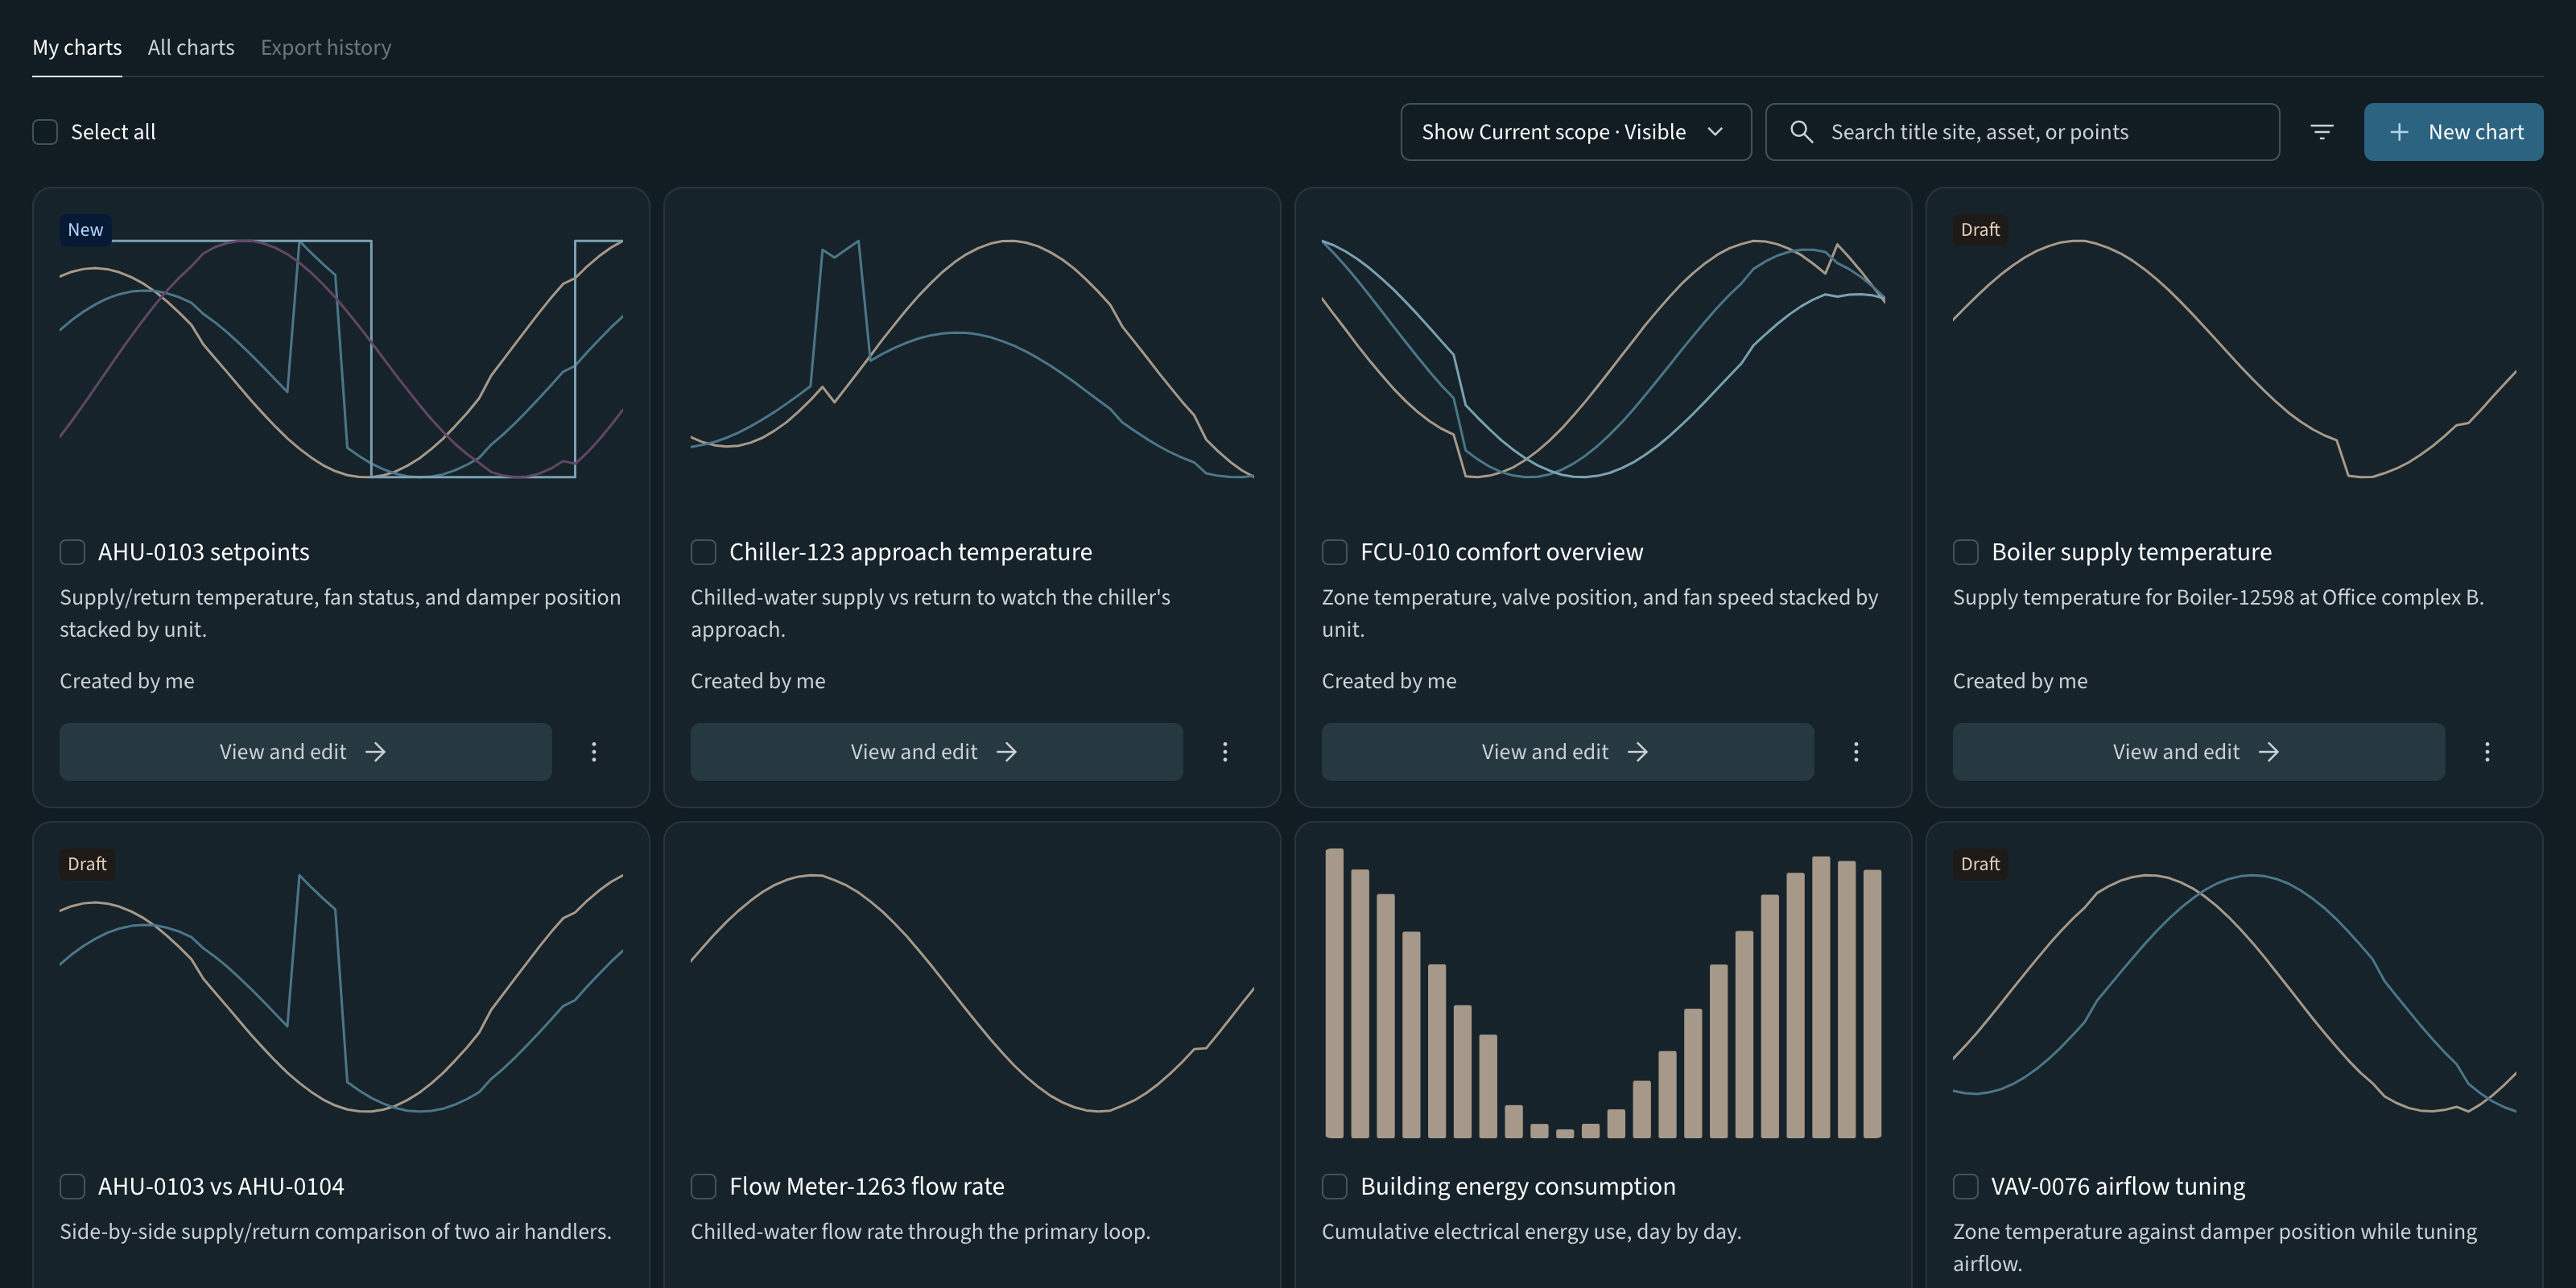
This prototype is available on desktop-sized screens.
Design beyond a single chart
Saving, reopening, duplication, sharing, and scheduled exports extend analysis into recurring work. Data extraction is separate from chart creation, so the chart's point limit does not apply to exports.
Outcomes & scope
The core chart-building interactions were implemented in the product. Early UAT with two to three users provided encouraging qualitative feedback relative to the legacy experience.
50% faster report creation: Based on limited usability testing of selected reporting tasks and Operations team estimates.
Learnings & reflection
Useful control includes understandable constraints. Next, I would evaluate point discovery, comparison, and returning to an analysis through task completion, errors, and time.