Data Visualization StandardsScaling Data Visualization Across the Design System
Created a shared data visualization standard that helped product teams choose, design, and implement accessible charts consistently across the JLL ecosystem.
Product teams were designing charts independently, creating inconsistent color usage, interaction patterns, and accessibility across the product ecosystem.
Designers and engineers lacked shared guidance for choosing the right chart, handling complex data states, and translating design decisions into implementation.
Choose a chart from the user's question
Teams needed more than finished chart templates. I organized selection around change over time, ranking, comparison, and composition, connecting analytical intent to a reusable visualization pattern.
JLL Solstice design system
Data Visualization
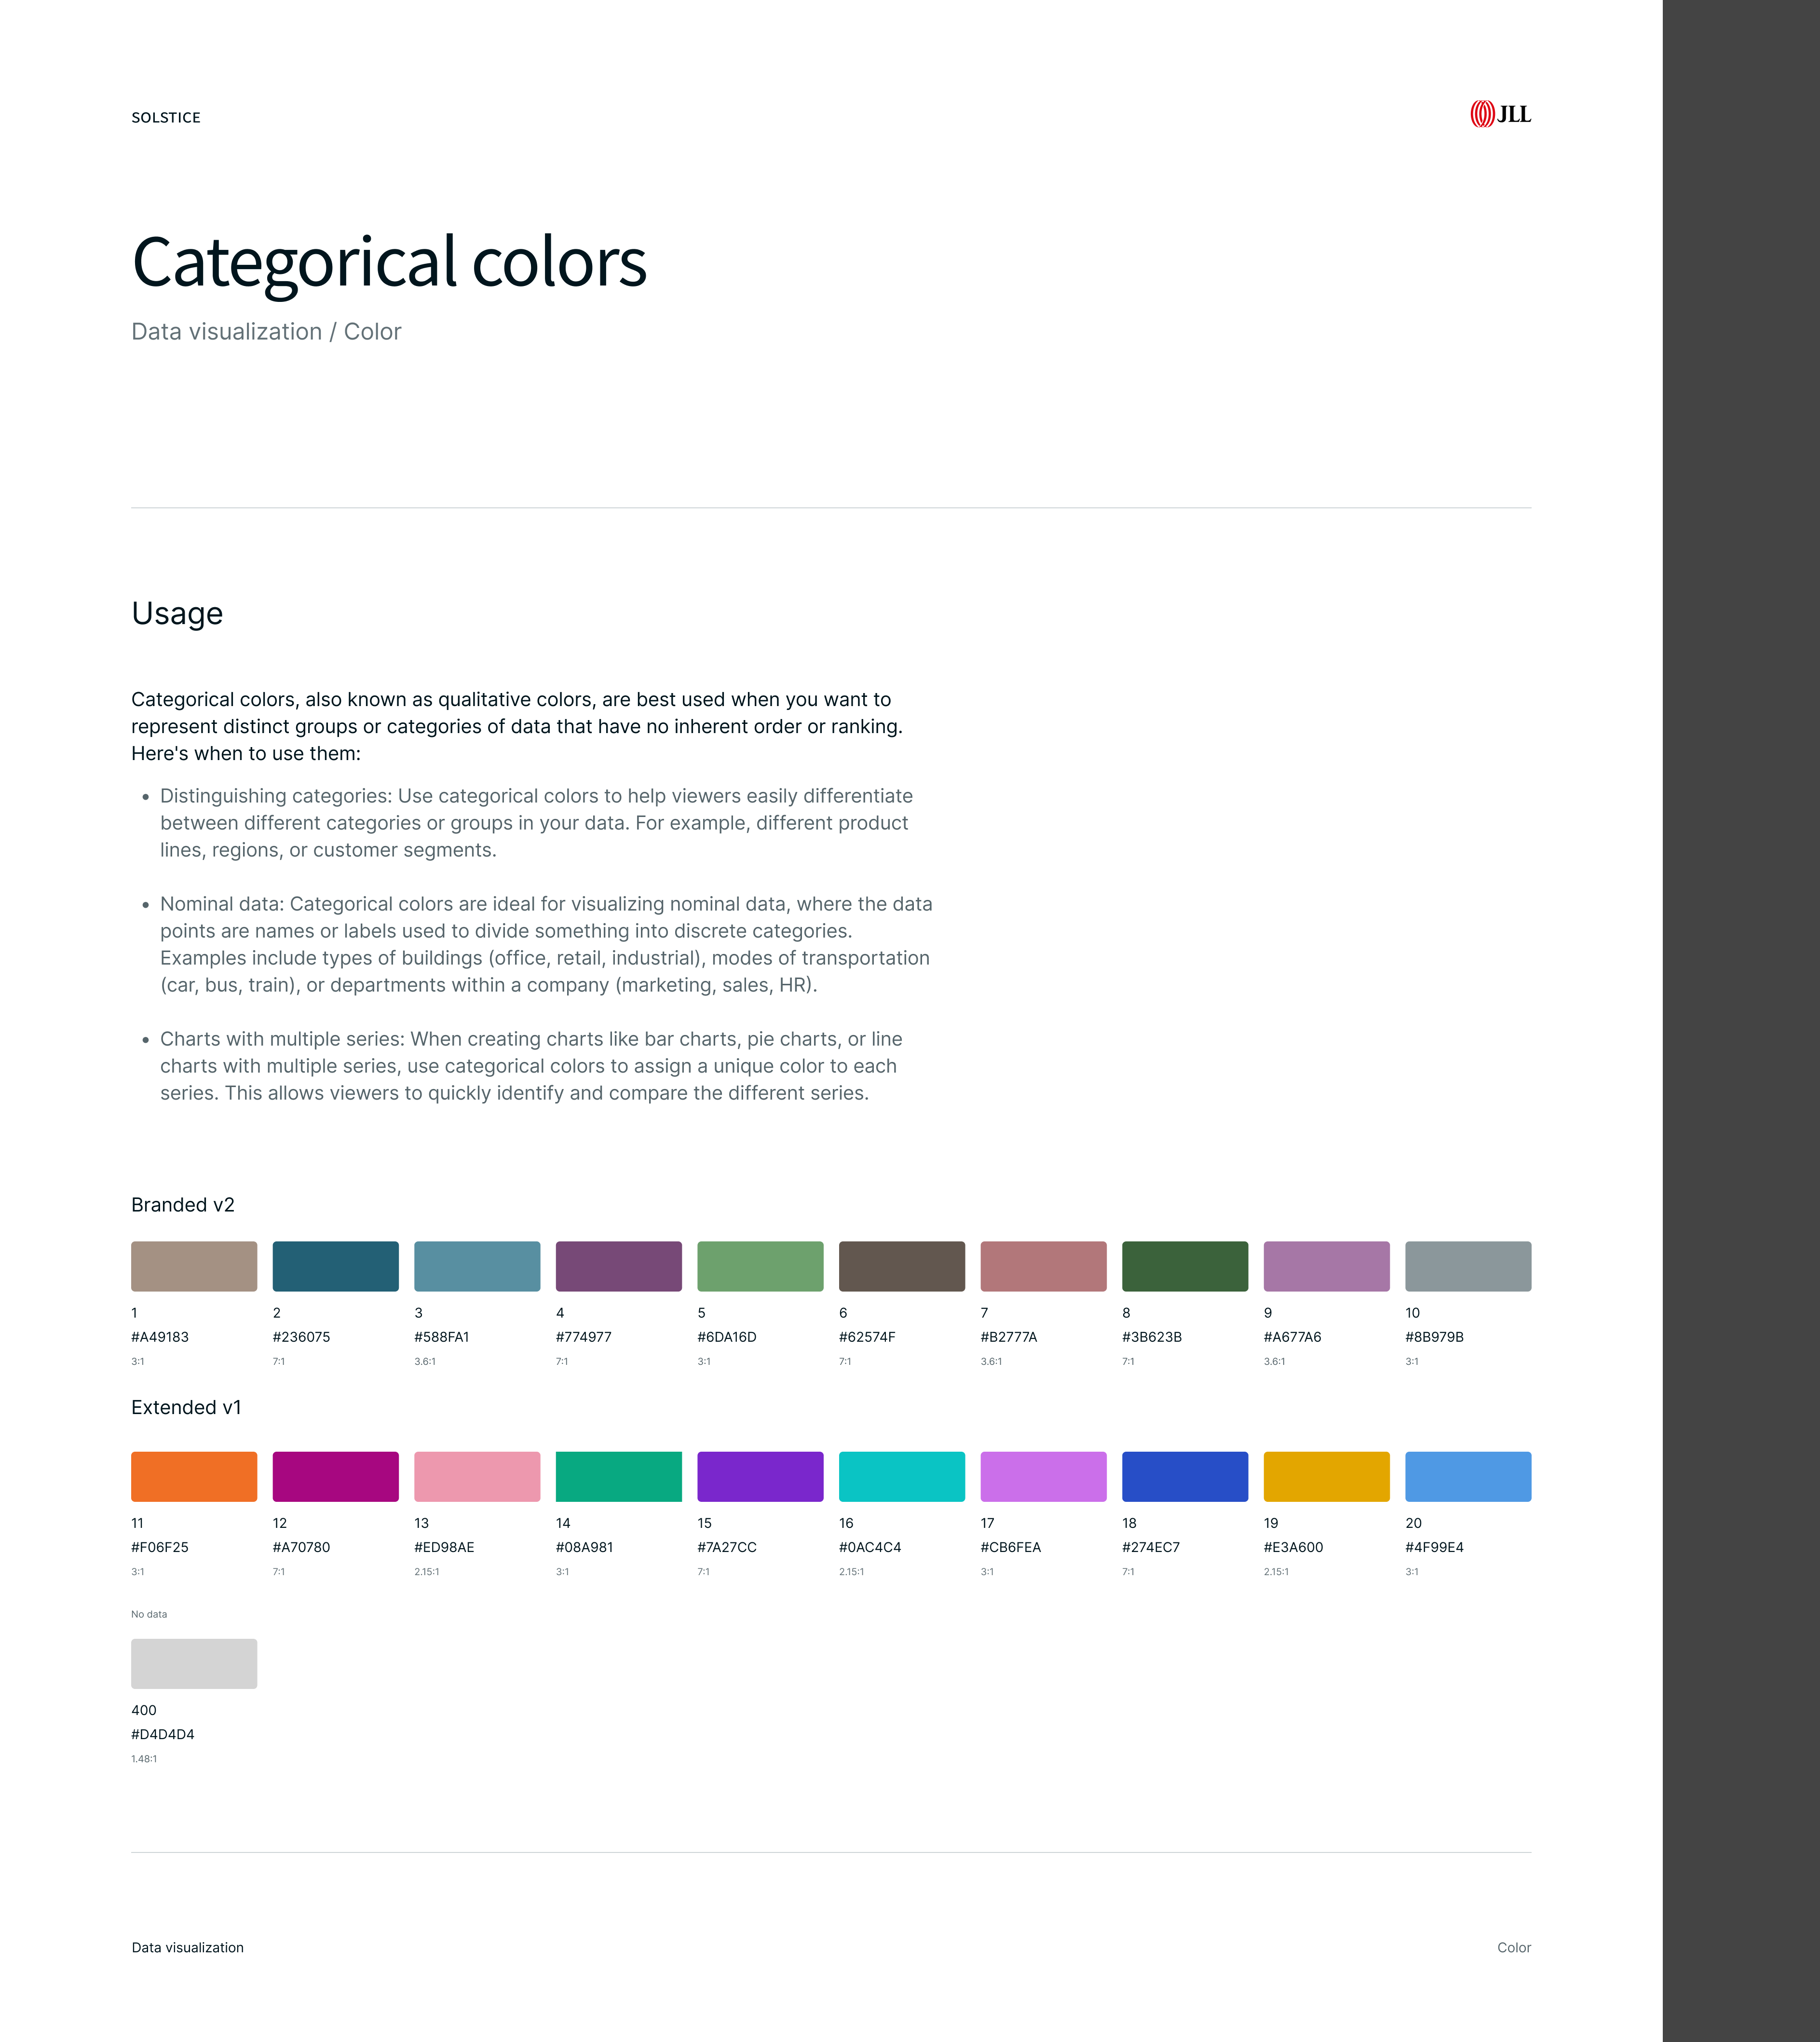
Make accessibility part of the specification
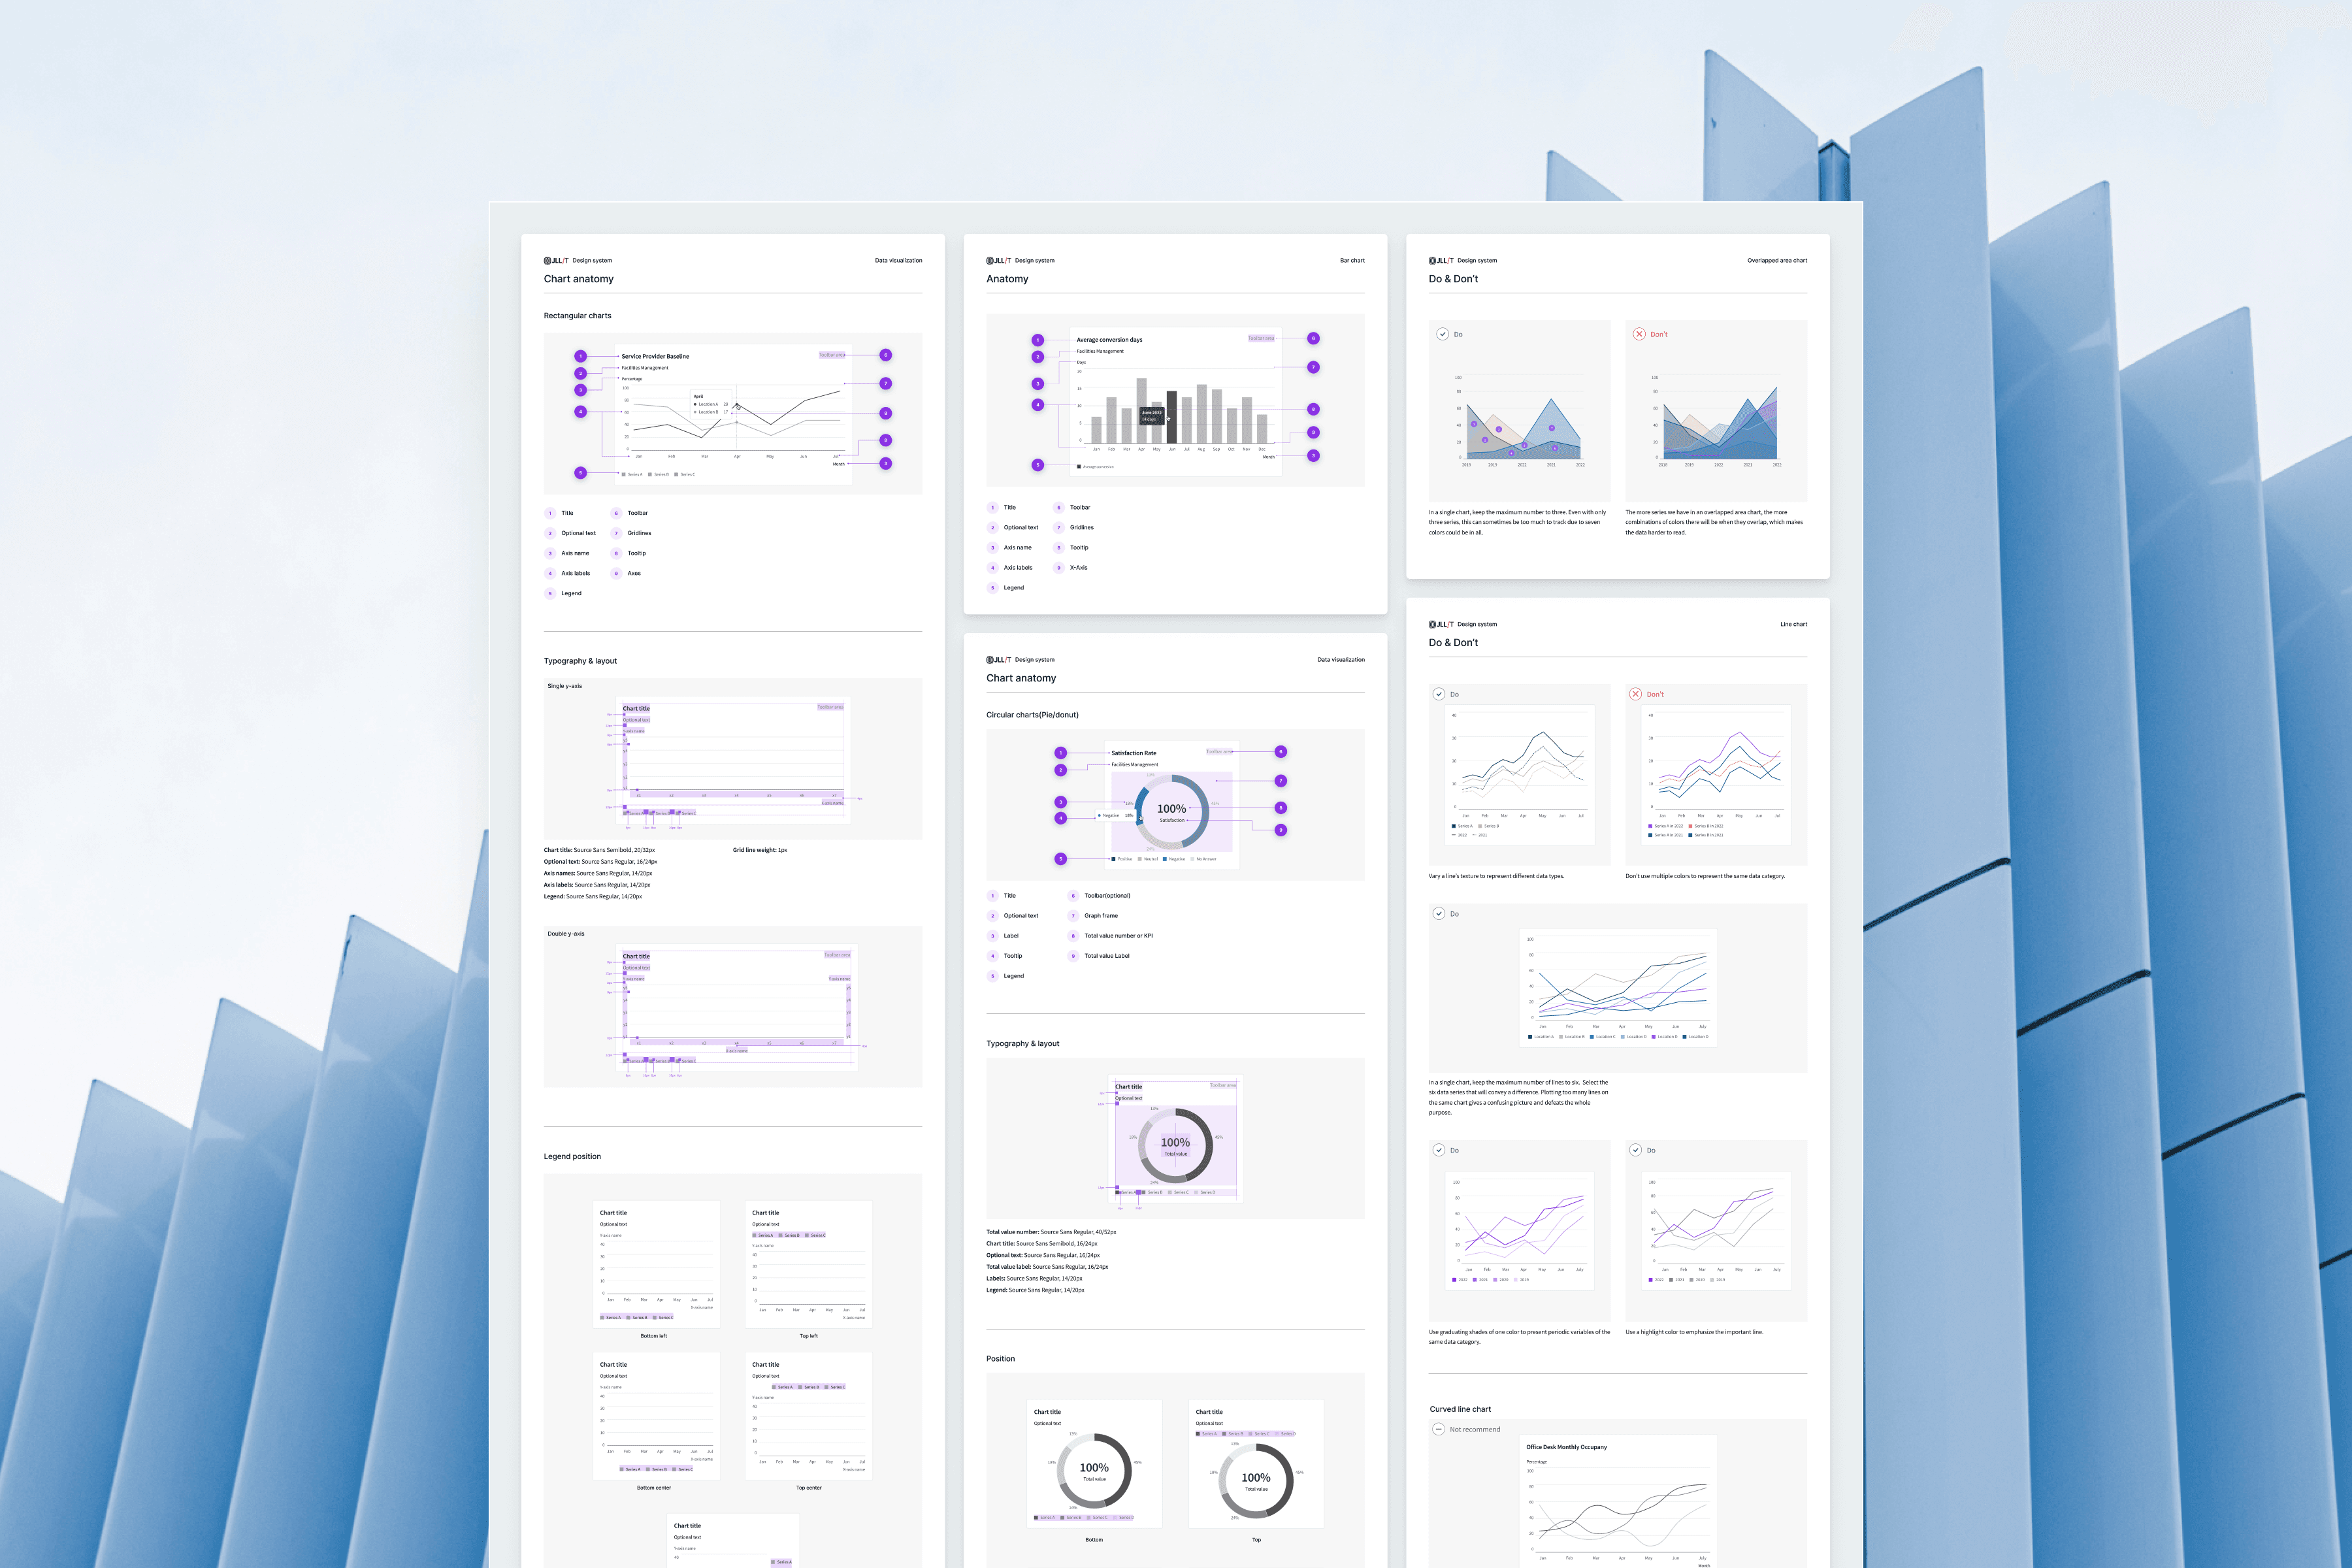
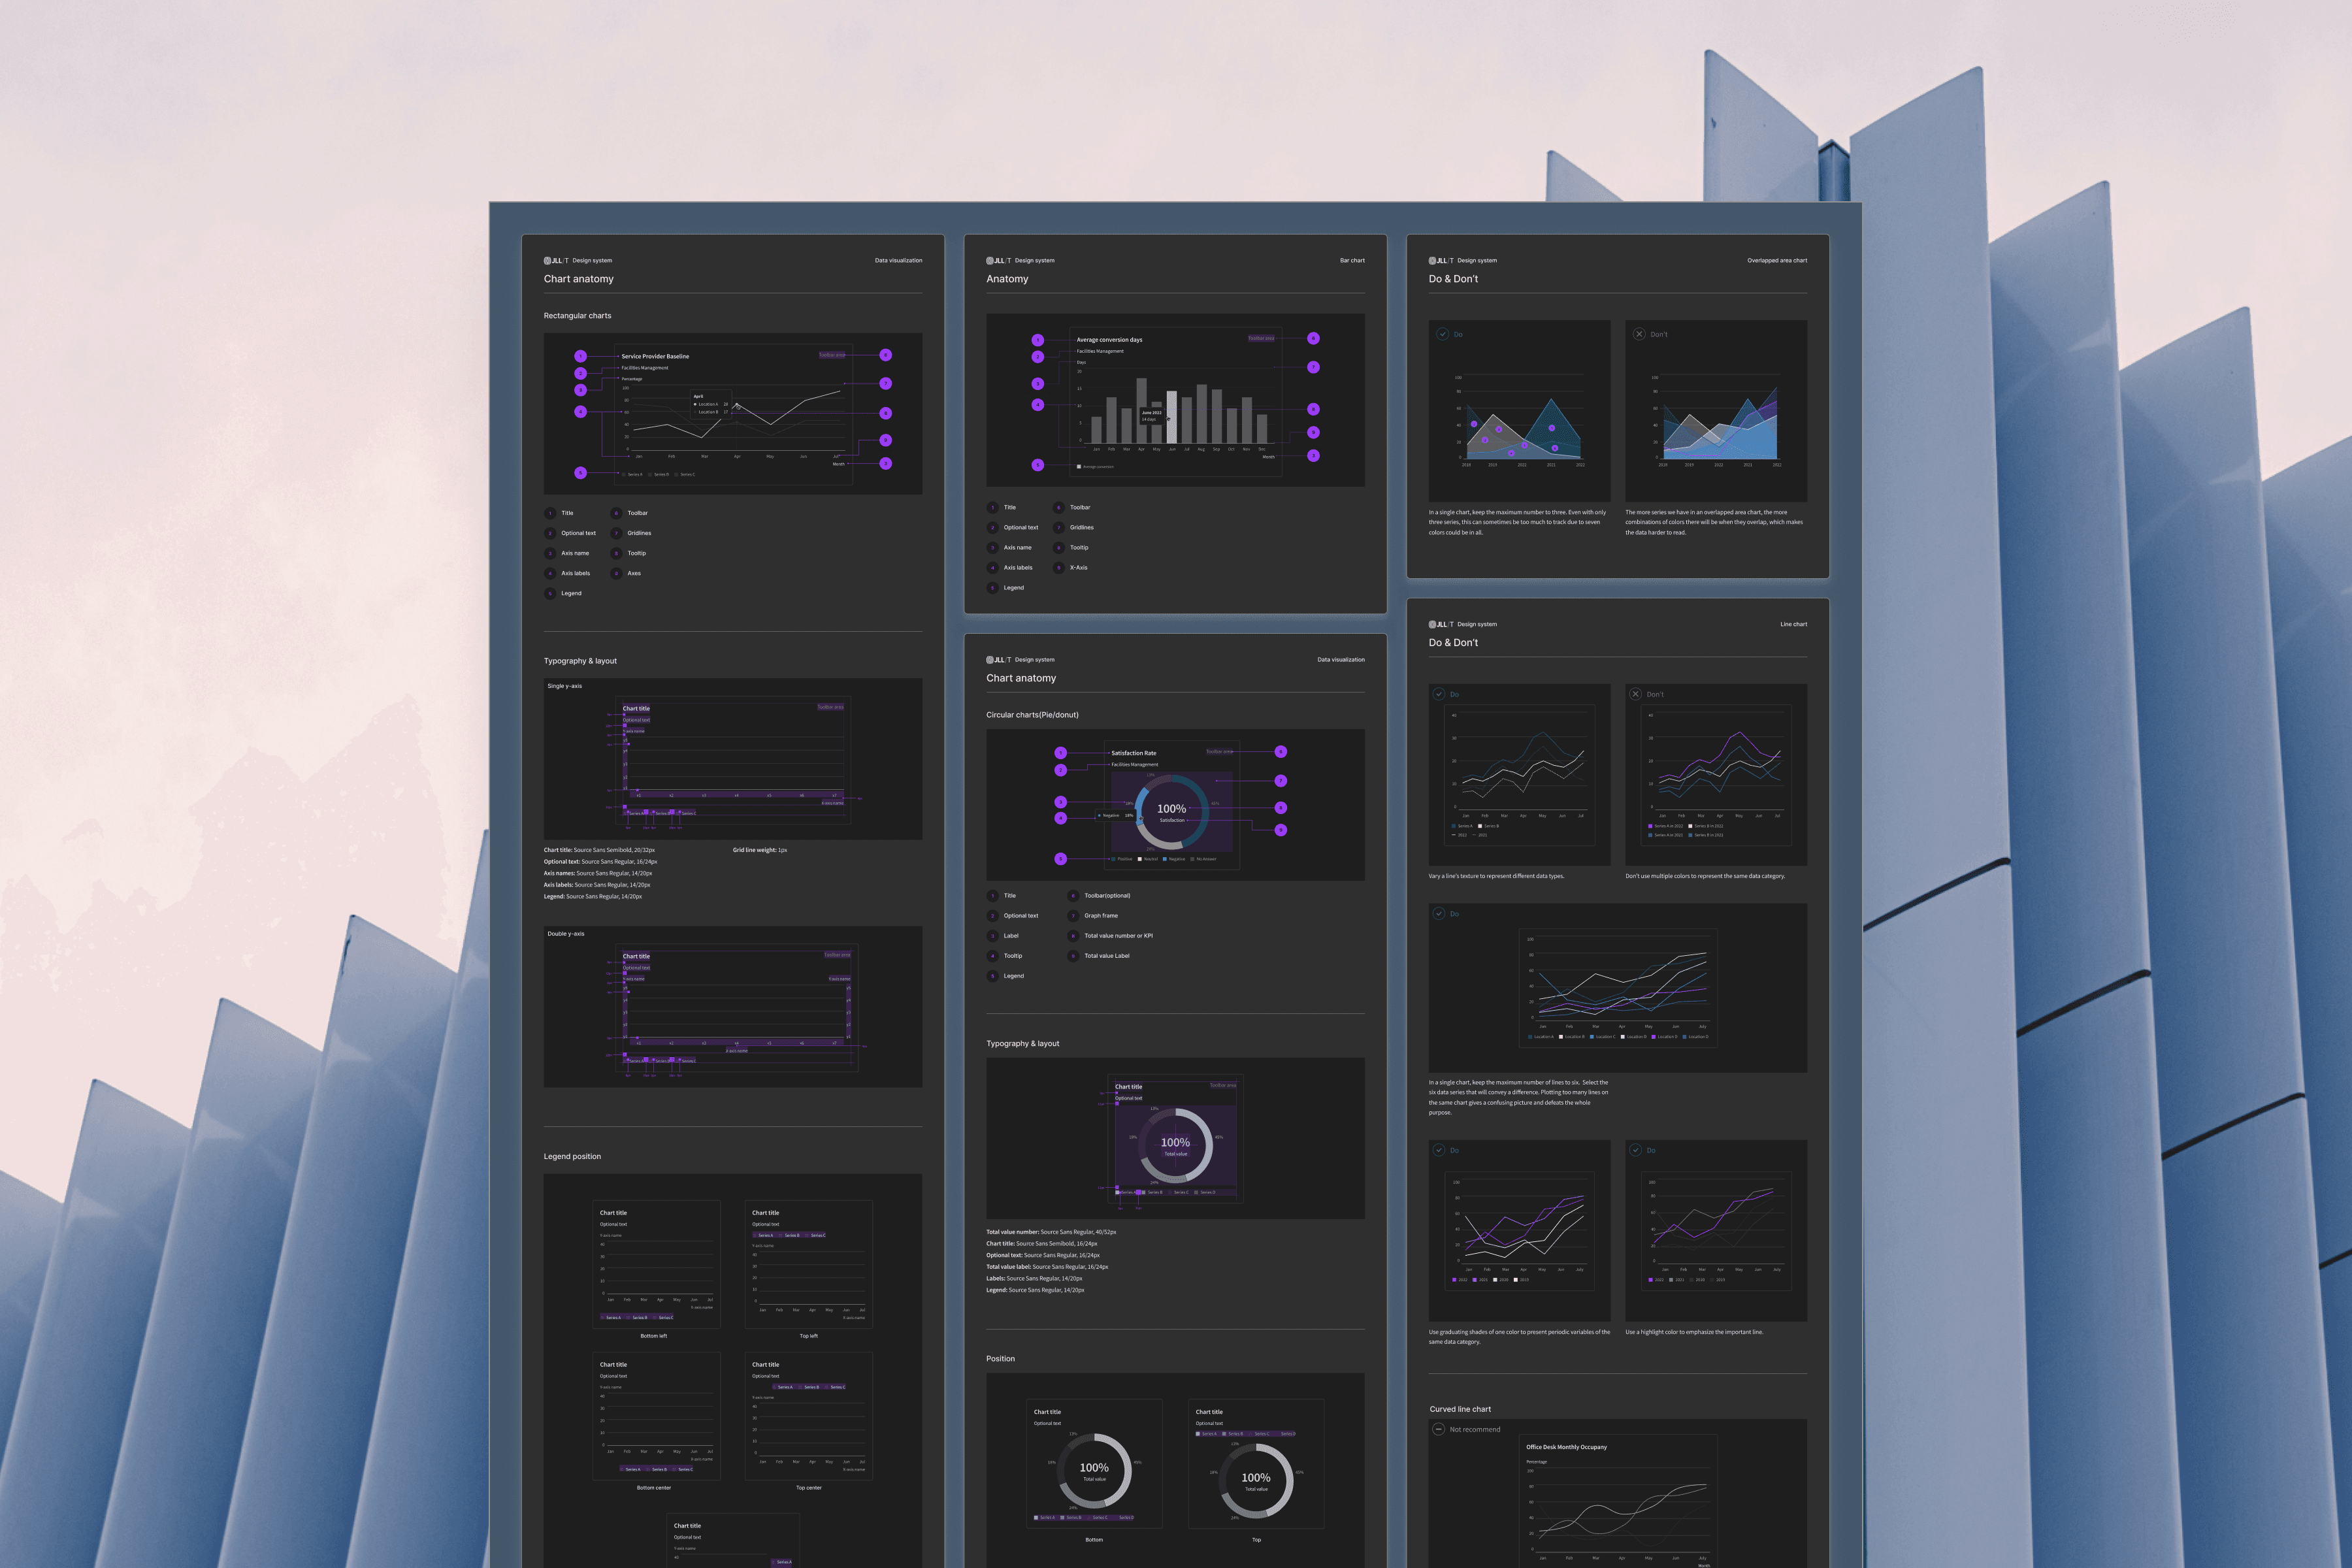
Color meaning, contrast, redundant cues, and light and dark behavior were built into shared guidance. Anatomy rules covered axes, labels, legends, tooltips, and responsive behavior so teams could implement the same principles consistently.
Outcomes & scope
31 product teams: Adopted the shared data visualization standard across the JLL ecosystem.
11 chart patterns: Standardized common visualization use cases across change, ranking, comparison, and composition.
5 color systems: Defined consistent semantic and analytical color usage for light and dark themes.
2 anatomy frameworks: Established shared specifications for rectangular and circular charts.
Learnings & reflection
A data visualization system needs to standardize decisions, not just appearance. Teams gained more value from knowing when and why to use a pattern than from receiving finished chart templates.
Accessibility worked best as a system constraint. Building contrast, redundancy, and theme behavior into the standards made inclusive outcomes easier to repeat.